. 2008 Aug 19;105(33):11703-8.
doi: 10.1073/pnas.0709403105. Epub 2008 Aug 7.

Yeast linker histone Hho1p is required for efficient RNA polymerase I processivity and transcriptional silencing at the ribosomal DNA

Affiliations

Yeast linker histone Hho1p is required for efficient RNA polymerase I processivity and transcriptional silencing at the ribosomal DNA

Anat Levy et al. Proc Natl Acad Sci U S A. .

Abstract

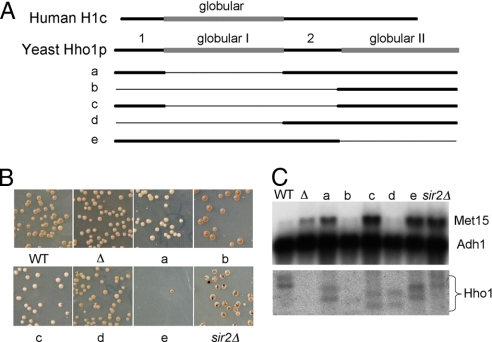
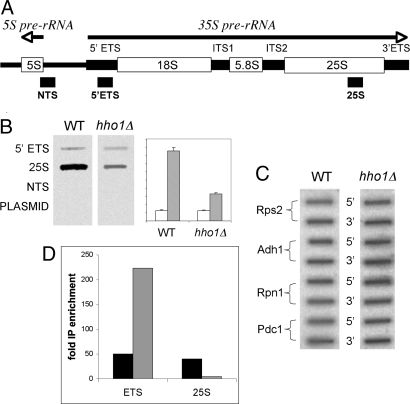
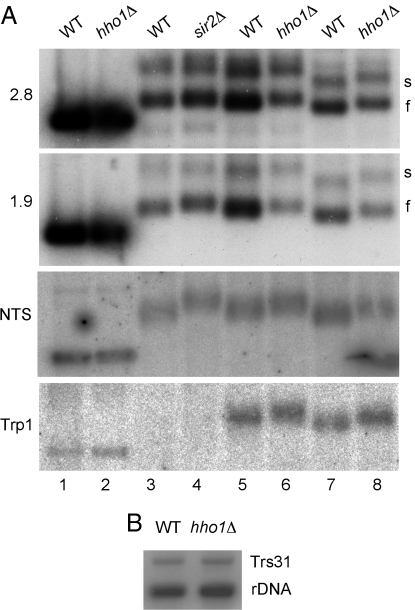
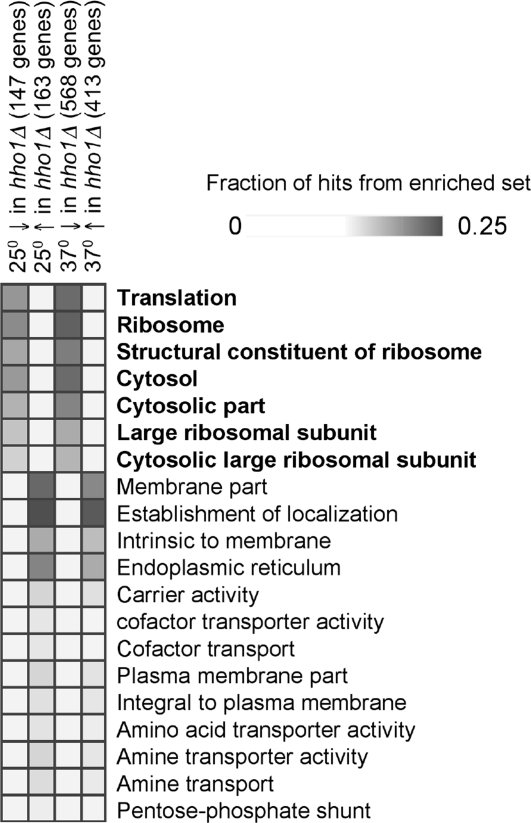
Nucleosome core particles in eukaryotes are linked by a stretch of DNA that is usually associated with a linker histone. Here, we show in yeast, that the presence of yeast linker histone Hho1p represses expression of a pol II transcribed gene (MET15) embedded in the rDNA. In vivo deletions of Hho1p sequences showed that the second globular domain is sufficient for that repression, whereas the presence of the N terminus is required for its derepression. In contrast, a run-on assay confirmed by a ChIP experiment showed that Hho1p is required for maximal pol I processivity during rDNA transcription. Psoralen accessibility experiments indicated that Hho1p is necessary for normal rDNA compaction. DNA array expression analysis comparing RNA transcripts in wild-type and hho1 strains before and after a heat-shock showed that Hho1p is necessary to achieve wild-type mRNA levels of transcripts that encode ribosomal components. Taken together, our results suggest that Hho1p is involved in rDNA compaction, and like core histones, is required for efficient rDNA transcription by pol I.


Conflict of interest statement

The authors declare no conflict of interest.

Figures

Fig. 1.
Fig. 1.
An HHO1 disruption results in increased MET15 expression. (A) Schematic diagram illustrating hho1 deletions a-e. Human H1c is drawn as a reference (drawn to scale). (B) Mutant and wild-type strains were plated on Pb+ indicator plates. The lighter the color of the colony, the more MET15 expression, and the lower the presumed rDNA compaction. Sectors resulting from homologous recombination in the rDNA and loss of the MET15 gene are most numerous in the sir2Δ strain (JS218). Colonies were plated at 30°C for 5 days and then at 4°C for 1 additional week before photography. (C) Northern blot monitoring the expression of MET15 in the different mutants of Hho1 and sir2. Fragments of MET15 and ADH1 were used simultaneously as probes. Identical amounts of total cell RNA were loaded in each lane. A parallel gel (shown below) was probed with an Hho1 fragment. There are consistently two different-sized transcripts for Hho1. The differing sizes of the Hho1 transcripts in the different lanes correspond to the deletions made in the Hho1 gene by the mutagenesis. The hho1Δ deletion strain shows no hho1 transcript. Quantitation of the transcripts, normalized to the Adh1 probe, is presented in Table S1).
Fig. 2.
Fig. 2.
Pol I processivity is defective in the hho1Δ mutant. Run-on transcription was performed as described in Methods. (A) Schematic diagram of the rDNA transcription unit. RNA polymerase I transcribes the 35S primary rRNA transcript. DNA sequences serving as probes in B and corresponding to the indicated segments of the nontranscribed spacer (NTS), the 5′ external transcribed spacer (5′ ETS), and the 25S rRNA are indicated. (B) Slot blot hybridization of the probes described in A with labeled RNA from wild-type and hho1Δ cells. Quantitation of two separate experiments with standard deviation bars on right (arbitrary abscissa units). Open and stippled bars represent ETS and 25S probes, respectively. (C) Slot blot hybridization of PCR amplified DNA fragments from 5′ and 3′ ends of genes transcribed by pol II. Primers are listed in Table S3. (D) Quantitation of ChIP experiment verifying defective RNA pol I processivity in hho1Δ. cross-linked, HA-tagged RNA pol I was immunoprecipitated from wild type and hho1Δ cells together with associated DNA. After cross-link reversal, quantitative PCR of ETS and 25S rDNA sequences were performed. Black and stippled bars represent enrichment of the DNA sequences relative to input DNA precipitated from wild-type and hho1Δ extracts, respectively.
Fig. 3.
Fig. 3.
Deletion of Hho1 leads to increased chromatin accessibility to psoralen. (A) Psoralen cross-linking of rDNA. Wild-type, hho1Δ, and sir2Δ logarithmic cell cultures were exposed to 10 μg/ml psoralen and 365-nm UV light for 40 min. DNA was extracted, digested with EcoR1, electrophoresed on a 1.3% agarose gel, the cross-linking reversed and blotted onto a nitrocellulose membrane. The blot was probed with probes that recognize 1.9 and 2.8 kb fragments of the 35S rRNA transcript, the rDNA NTS, and the TRP1 gene. Strains used for the SIR2 control were deleted for TRP1. Blots were exposed to a phosphorimager screen. Cultures in lanes 1–6 were harvested at 0.3 OD600, lanes 7 and 8 at 0.9 OD600. (B) Copy number comparison of wild-type and hho1Δ strains. Extracted DNA was digested with EcoR1 and BamH1, electrophoresed, and blotted as above. The blot was probed with a mixture of two probes recognizing the 1.9-kb rDNA fragment and single-copy TRS31 DNA. Quantitation of the bands showed an rDNA/TRS31 ratio of 4.31 in the wild-type and 3.74 in the hho1Δ strain.
Fig. 4.
Fig. 4.
GO ontology of gene lists generated by expression microarray analysis. The fraction of hits from sets that are found in different GO ontology sets are displayed graphically (36). Here, we show only 20 of the categories. The analysis shown here was performed on gene sets after removal of genes expressed at a very low level (<500 units in the raw data). Above each column, the title relates to whether the gene set was higher (↑) or lower (↓) in the hho1Δ mutant than the wild type, and how many genes were in each set (in parentheses). GO ontologies that relate to translation are bolded. The complete figure and quantitative results can be found in Fig. S1.

References

    1. Baxevanis AD, Landsman D. Histone sequence database: A compilation of highly-conserved nucleoprotein sequences. Nucleic Acids Res. 1996;24:245–247. - PMC - PubMed
    1. Woodcock CL, Skoultchi AI, Fan Y. Role of linker histone in chromatin structure and function: H1 stoichiometry and nucleosome repeat length. Chromosome Res. 2006;14:17–25. - PubMed
    1. Simpson RT. Structure of the chromatosome, a chromatin particle containing 160 base pairs of DNA and all the histones. Biochemistry. 1978;17:5524–5531. - PubMed
    1. Kasinsky HE, Lewis JD, Dacks JB, Ausió J. Origin of H1 linker histones. FASEB J. 2001;15:34–42. - PubMed
    1. Cerf C, et al. Homo- and heteronuclear two-dimensional NMR studies of the globular domain of histone H1: Full assignment, tertiary structure, and comparison with the globular domain of histone H5. Biochemistry. 1994;33:11079–11086. - PubMed

Publication types

MeSH terms

Associated data