. 2008 Aug 19;105(33):12075-80.
doi: 10.1073/pnas.0804636105. Epub 2008 Aug 7.

A photoactive carotenoid protein acting as light intensity sensor

Affiliations

A photoactive carotenoid protein acting as light intensity sensor

Adjélé Wilson et al. Proc Natl Acad Sci U S A. .

Abstract

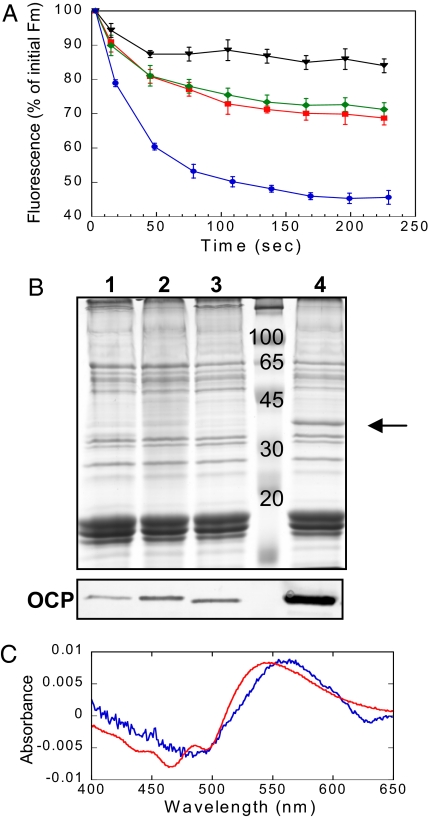
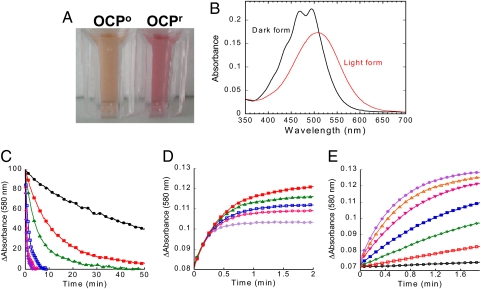
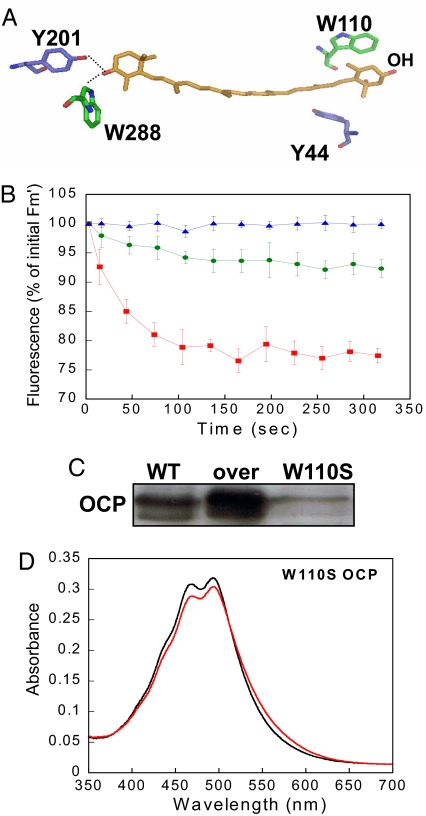
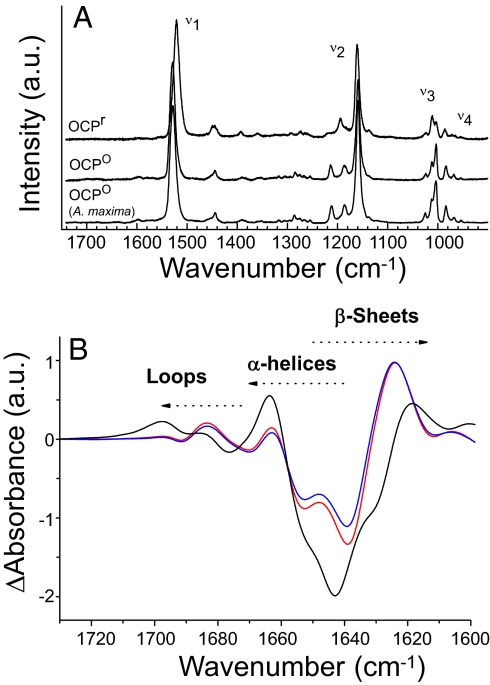
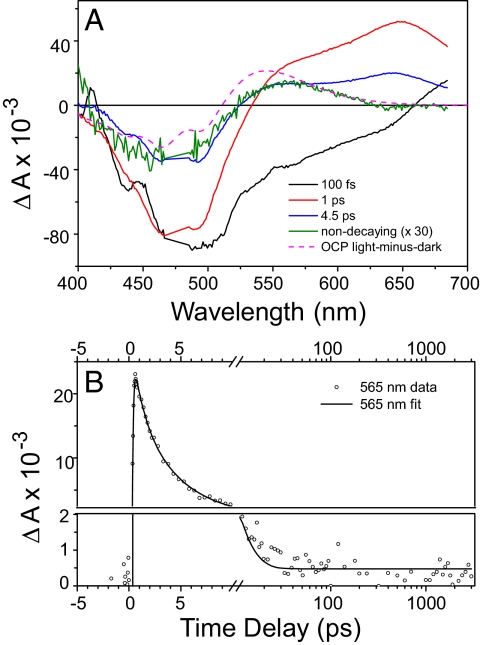
Intense sunlight is dangerous for photosynthetic organisms. Cyanobacteria, like plants, protect themselves from light-induced stress by dissipating excess absorbed energy as heat. Recently, it was discovered that a soluble orange carotenoid protein, the OCP, is essential for this photoprotective mechanism. Here we show that the OCP is also a member of the family of photoactive proteins; it is a unique example of a photoactive protein containing a carotenoid as the photoresponsive chromophore. Upon illumination with blue-green light, the OCP undergoes a reversible transformation from its dark stable orange form to a red "active" form. The red form is essential for the induction of the photoprotective mechanism. The illumination induces structural changes affecting both the carotenoid and the protein. Thus, the OCP is a photoactive protein that senses light intensity and triggers photoprotection.


Conflict of interest statement

The authors declare no conflict of interest.

Figures

Fig. 1.
Fig. 1.
Relationship between blue-green light induced NPQ and the OCP in whole cells. (A) Decrease of maximal fluorescence (Fm') during exposure of WT (red squares), over-expressing OCP mutant (blue circles), His-tagged OCP/Km resistant mutant (green romboids) and His-tagged OCP/Sp resistant mutant (black triangles) cells to 740-μmol photons m−2 s−1 of blue-green light (400–550 nm). The graph is the average of four independent experiments and the error bars show the maximum and the minimum fluorescence value for each point. The cells were diluted to 3-μg chlorophyll/ml. (B) Coomassie blue-stained gel electrophoresis and immunoblot detection (bottom panel) in membrane-phycobilisome fractions from His-tagged OCP/Sp resistant mutant (1), His-tagged OCP/Km resistant mutant (2), WT (3), and over-expressing OCP mutant (4). The arrow indicates the OCP. Each lane contained 1.5-μg chlorophyll. (C) OCPr is present in whole cells under NPQ-inducing conditions. Difference light-minus-dark absorbance spectrum of the isolated OCP (red) compared with the double difference absorbance spectrum: light-minus-dark overexpressing OCP cells spectrum minus light-minus-dark ΔOCP cells [strain without OCP (9)] (average of five independent experiments). The illumination of cells and spectra recording were realized at 11°C.
Fig. 2.
Fig. 2.
Isolated OCP is responsive to blue-green light : Photoconversion and dark recovery. (A) Photograph of isolated OCP° and OCPr. To obtain OCPr the isolated protein was illuminated with a blue-green light at 740-μmol photons m−2 s−1 at 12°C for 2 min. (B) Absorbance spectra of the dark orange form (OCP°; black) and the light red form (OCPr; red). (C) Darkness red OCPr to orange OCP° conversion (decrease of the absorbance at 580 nm) and (D) photoconversion from the OCP° to the OCPr form using a 350-μmol photon m−2 s−1 blue-green light intensity (increase of the absorbance at 580 nm) at different temperatures: 32°C (violet), 28°C (rose), 24°C (blue), 19°C (green), 15°C (red), and 11°C (black). (E) OCPr accumulation at 11°C and different light intensities: 20 (black), 50 (red), 120 (green), 210 (blue), 350 (rose), 740 (orange), and 1,200 (violet)-μmol photons m−2 s−1 of blue-green (400–550 nm). The protein concentration was OD 0.2 at 495 nm.
Fig. 3.
Fig. 3.
The OCPr is essential for the induction of the photoprotective mechanism. (A) Shown is 100% conserved Tyr and Trp interacting with the carotenoid. (B) Decrease of Fm' during exposure of WT (red squares), overexpressing W110S OCP mutant (green circles), and His-tagged W110S OCP resistant mutant (blue triangles) cells to 740-μmol photons m−2 s−1 of blue-green light (400–550 nm). (C) Immunoblot detection in membrane-phycobilisome fractions from WT (1), overexpressing W110S OCP mutant (2), and His-tagged W110S OCP (3). Each lane contained 1.5-μg chlorophyll (D). Absorbance spectra of the dark orange form (OCP°; black) and the light form (OCPr; red). The OCP° was illuminated during 15 min at 1,200-μmol photons m−2 s−1 and at 10°C.
Fig. 4.
Fig. 4.
Changes in the carotenoid and the protein upon illumination. (A) Resonance Raman spectra of Synechocystis PCC 6803 OCPr and OCP° and Arthrospira maxima OCP° in the 1,740 to 820 cm−1 range and (B) light-minus-dark FTIR spectra of OCP in H2O (black) and in D2O ≈5 (red line) and 50 (blue line) seconds after illumination with a blue LED in the carbonyl region between 1,730 and 1,600 cm − 1 (Amide I region). The OCPr minus OCP° Amide I differential pattern is assigned to H-bond loosening (upshift) of the loops and α-helices carbonyl modes together with a H-bond strengthening (downshift of carbonyl modes) of the β-sheet.
Fig. 5.
Fig. 5.
Primary photochemistry of OCP revealed by femtosecond spectroscopy. OCP was excited with 50-fs flashes at 475 nm and the absorbance changes were monitored between 400 and 675 nm at time delays up to 3 ns. (A) Global analysis of time resolved data in the form of Evolution-Associated Difference Spectra (EADS). Four kinetic components with time constant of 100 fs (black), 1 ps (red), 4.5 ps (blue), and a long-lived component (green, expanded 30×). (B) Kinetic trace recorded at 565 nm (symbols) and the result of the global analysis (solid line). After decay of carotenoid excited-state signals on the picosecond timescale, a nondecaying photoproduct is formed at low yield. Note that the time axis is linear up to 10 ps and logarithmic thereafter. The vertical axis is split into two linear axes to show the long-lived product.
Fig. 6.
Fig. 6.
Structural similarity between the OCP C-terminal domain and the core linker protein APLC 7.8. (A) Superposition of the three strand β-sheet and the α-helix of the linker protein (blue) and of the C-terminal domain of the OCP (red). (B) The OCP C-terminal domain (red) showing the carotenoid and the Y203 and W290 residues (green stick representation) superimposed onto the linker protein structure (blue).

References

    1. Horton P, Ruban AV, Walters RG. Regulation of light harvesting in green plants. Annu Rev Plant Physiol Plant Mol Biol. 1996;47:655–684. - PubMed
    1. Niyogi K. Photoprotection revisited: genetic and molecular approaches. Annu Rev Plant Mol Biol. 1999;50:333–359. - PubMed
    1. Demming-Adams B, Adams WW., III Antioxidants in photosynthesis and human nutrition. Science. 2002;298:2179–2153. - PubMed
    1. Holt N, Zigmantas D, Valkunas L, Li X-P, Niyogi K, Fleming G. Carotenoid cation formation and the regulation of photosynthetic light harvesting. Science. 2005;307:433–436. - PubMed
    1. Standfuss J, et al. Mechanisms of photoprotection and non-photochemical quenching in pea light harvesting complex at 25Å resolution. EMBO J. 2005;24:919–928. - PMC - PubMed

Publication types