. 2008 Aug 8;321(5890):843-7.
doi: 10.1126/science.1159407.

Deletional tolerance mediated by extrathymic Aire-expressing cells

Affiliations

Deletional tolerance mediated by extrathymic Aire-expressing cells

James M Gardner et al. Science. .

Abstract

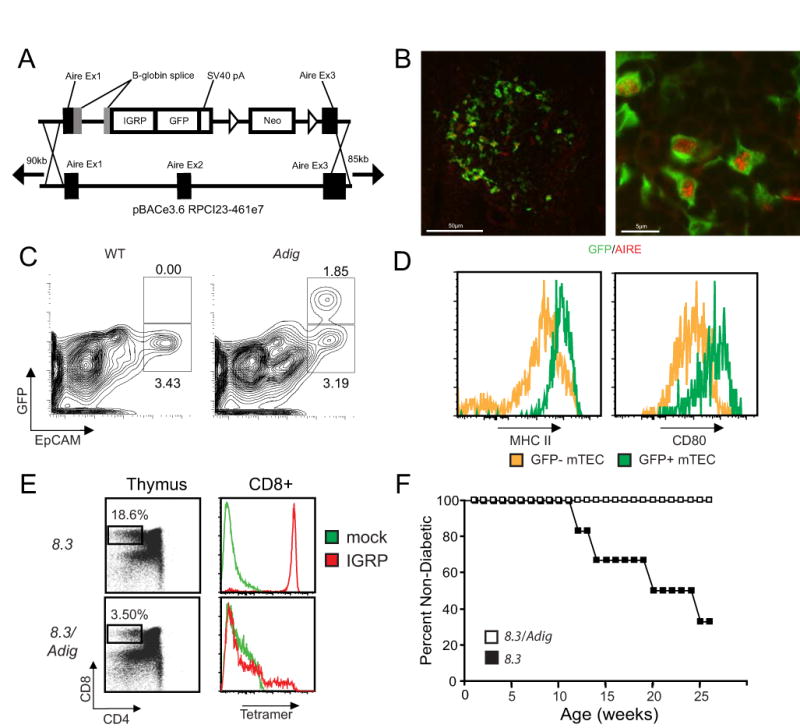
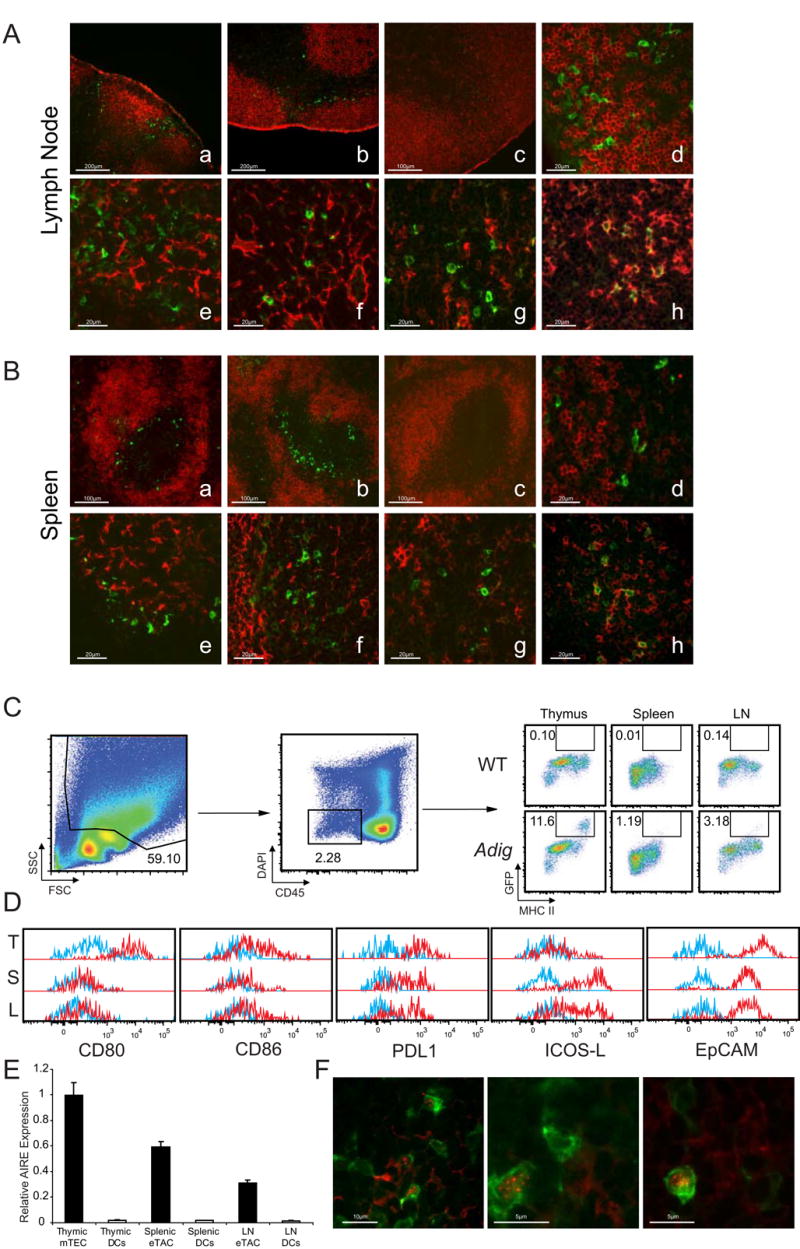
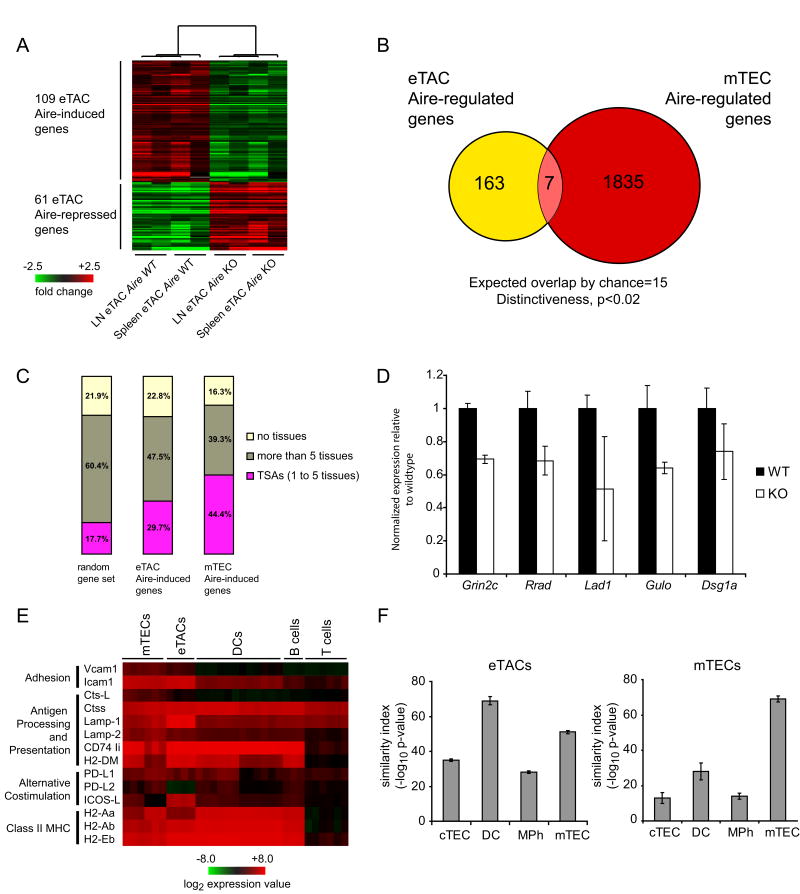
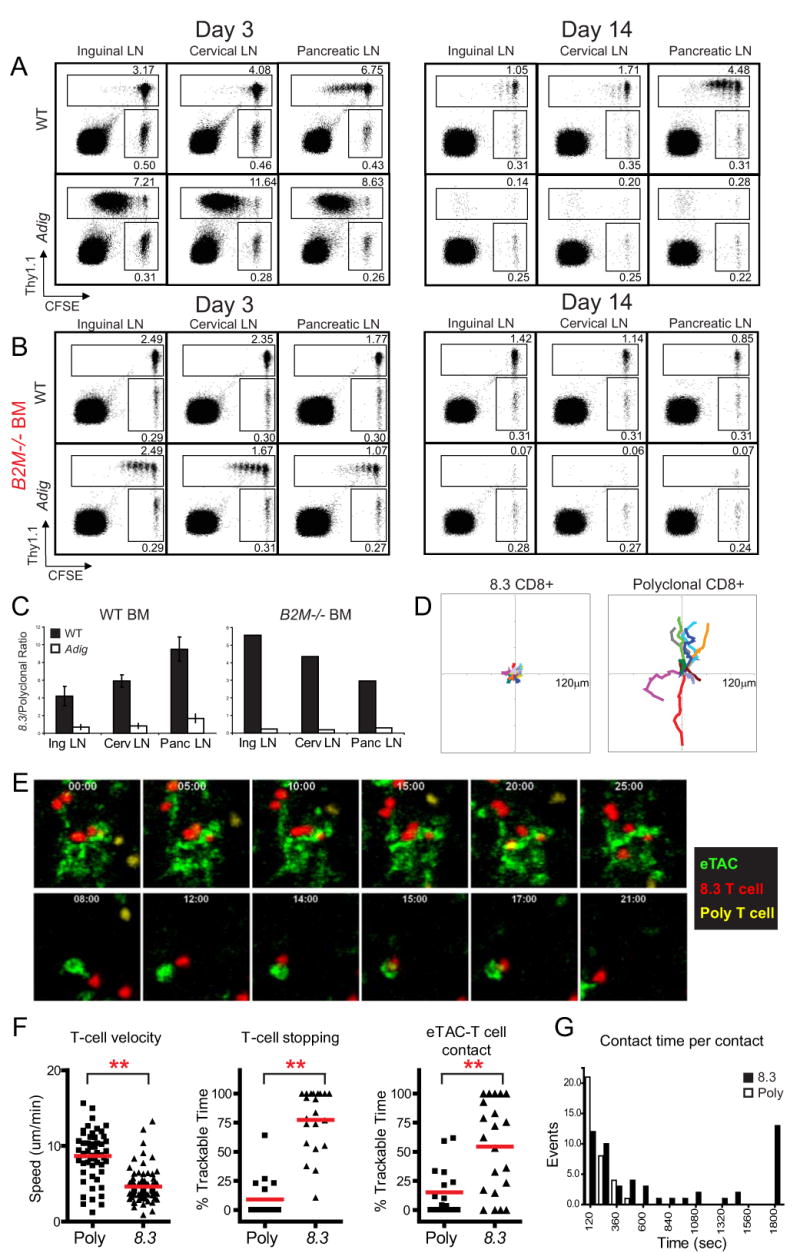
The prevention of autoimmunity requires the elimination of self-reactive T cells during their development and maturation. The expression of diverse self-antigens by stromal cells in the thymus is essential to this process and depends, in part, on the activity of the autoimmune regulator (Aire) gene. Here we report the identification of extrathymic Aire-expressing cells (eTACs) resident within the secondary lymphoid organs. These stromally derived eTACs express a diverse array of distinct self-antigens and are capable of interacting with and deleting naïve autoreactive T cells. Using two-photon microscopy, we observed stable antigen-specific interactions between eTACs and autoreactive T cells. We propose that such a secondary network of self-antigen-expressing stromal cells may help reinforce immune tolerance by preventing the maturation of autoreactive T cells that escape thymic negative selection.


Figures

Fig. 1
Fig. 1
The Adig transgene recapitulates Aire expression in the thymus and mediates negative selection of autoreactive T cells. (A) Schematic of Igrp-gfp transgene targeting into the Aire BAC. Targeting replaces Aire exon 2, the coding portion of exon 1 and part of exon 3, such that the transgene does not make functional Aire (B) Immunofluorescent staining of GFP (green) and Aire (red) in thymic frozen sections of Adig mice. (C) Flow cytometry of CD45-, DAPI-, Ly51lo-gated thymic stromal cells from wildtype (left) and Adig (right) NOD mice. (D) Flow cytometry of CD45-, DAPI-, Ly51lo, EpCAM+ mTECs from Adig NOD mice gated as GFP- (yellow) or GFP+ (green) and stained for MHC II (left) and CD80 (right). (E) Thymocytes from 8.3 TCR-transgenic mice (top panels) or double-transgenic 8.3/Adig mice (bottom panels) stained for CD4/CD8 (left panels), or pre-gated as CD4- CD8+ and stained for IGRP-mimetope (red) or mock (green) peptide/Kd tetramer reactivity (right panels). (F) Diabetes incidence curves for 8.3 TCR-transgenic mice (N=6) and 8.3/Adig double-transgenic mice (N=10).
Fig. 2
Fig. 2
Aire-expressing stromal cells exist in the secondary lymphoid organs. (A and B) Representative immunofluorescent costains of lymph node (A) and spleen (B) sections co-stained for GFP (green, all sections) and B220 (a-d), gp38 (e), ERTR-7 (f), CD11c (g), or MHC II (h; all red). Images a, b, and d-h are from Adig NOD mice, images c are from wildtype NOD mice. (C) Flow cytometric analysis and gating from Adig and wildtype NOD thymus, spleen, and lymph node stroma analyzed for CD45, DAPI, MHC II, and GFP. (D) Flow cytometric analysis of Adig NOD thymus (T), spleen (S), and lymph nodes (L), showing expression of indicated markers (red) or isotype staining (blue) in mTECs and eTACs respectively, defined as CD45-, DAPI-, MHC II+, GFP+. (E) Real-time PCR analysis of Aire expression relative to endogenous control in cell-sorted mTECs/eTACs (CD45-, PI-, MHC II+, CD11c-, EpCAM+) and DCs (CD45+, PI-, MHC II+, CD11c+, EpCAM-) of nontransgenic NOD thymus, spleen, and lymph node. (F) Immunofluorescent GFP (green)/Aire (red) costains of lymph nodes from Adig NOD mice.
Fig. 3
Fig. 3
Aire regulates the expression of a unique set of tissue-specific antigens in eTACs. (A) Heat map and unsupervised clustering of Aire-regulated genes in eTACs. Pooled eTACs were sorted from lymph nodes and spleens from cohorts of 3-6-week-old Adig Aire+/+ and Adig Aire-/- NOD mice. Each of the 8 arrays represents 3-5 pooled mice. (B) Schematic diagram of the unique and common genes regulated by Aire in eTACs and mTECs. (C) Classification of Aire-regulated genes in eTACs based on tissue-specificity, as compared to mTECs and to a random gene set. (D) Real-time PCR analysis of Aire-regulated TSAs in eTACs, normalized to endogenous control. eTACs were sorted from pooled nontransgenic Aire+/+ (black bars) and Aire-/- (white bars) NOD spleens based on the surface marker profile CD45-, PI-, CD11c-, MHC II+, EpCAM+, and characterized for expression of glutamate receptor NMDA2C (Grin2c), ras-related associated with diabetes (Rrad), ladinin (Lad1), gulonolactone (L-) oxidase (Gulo), and desmoglein 1 alpha (Dsg1a) (E) Expression of antigen processing and presentation genes in eTACs relative to other lymphoid cell populations after median-centered normalization to the expression of all genes in each array. (F) Global expression profile similarity of eTACs (left) and mTECs (right) to other relevant cell types based on Pearson correlation values calculated for population-specific centroids.
Fig. 4
Fig. 4
eTACs directly interact with autoreactive lymphocytes and mediate deletional tolerance. (A) Flow cytometry of CFSE-labeled and adoptively cotransferred 8.3 CD8+ T cells (Thy1.1) and polyclonal CD8+ T cells (Thy 1.2). Cells were harvested at day 3 (left) and day 14 (right) post-transfer (B) Adoptive transfer of the same donor populations as (A) into lethally irradiated wildtype (top) and Adig (bottom) recipients reconstituted with β2M-/- bone marrow. (C) Quantitation of antigen-specific deletion after adoptive transfer at day 14 in (A) and (B), showing the ratio of 8.3:polyclonal CD8+ T cells in wildtype (black) and Adig (white) NOD recipients. Representative of at least three mice each. (D-G) Two-photon imaging of 8.3 and polyclonal CD8+ T cells in axillary lymph nodes 4 hours after adoptive transfer into Adig NOD recipients. (D) 10-minute displacement analysis of all 8.3 CD8+ T cell tracks (left) and polyclonal CD8+ T cell tracks (right). (E) Representative images of interaction between 8.3 CD8+ T cells (red), polyclonal CD8+ T cells (yellow) and eTACs (green) (F) Average T cell track speed (left), percent of time in which a T cell is stopped (middle), and percent of time in which a T cell is making contact with an eTAC (right) among polyclonal (Poly) and 8.3 (8.3) CD8 T cells. ** P<0.001. (G) Histogram displaying the duration of individual T cell-eTAC interaction times per contact for polyclonal (black bars) and 8.3 (white bars) CD8+ T cells.

Comment in

References

    1. Smith KM, Olson DC, Hirose R, Hanahan D. Int Immunol. 1997;9:1355. - PubMed
    1. Derbinski J, Schulte A, Kyewski B, Klein L. Nature Immunol. 2001;2:1032. - PubMed
    1. Derbinski J, et al. J Exp Med. 2005;202:33. - PMC - PubMed
    1. Anderson MS, et al. Science. 2002;298:1395. - PubMed
    1. Liston A, Lesage S, Wilson J, Peltonen L, Goodnow CC. Nature Immunol. 2003;4:350. - PubMed

Publication types

MeSH terms