. 2008 Sep;173(3):844-55.
doi: 10.2353/ajpath.2008.080275. Epub 2008 Aug 7.

An antimetastatic role for decorin in breast cancer

Affiliations

An antimetastatic role for decorin in breast cancer

Silvia Goldoni et al. Am J Pathol. 2008 Sep.

Abstract

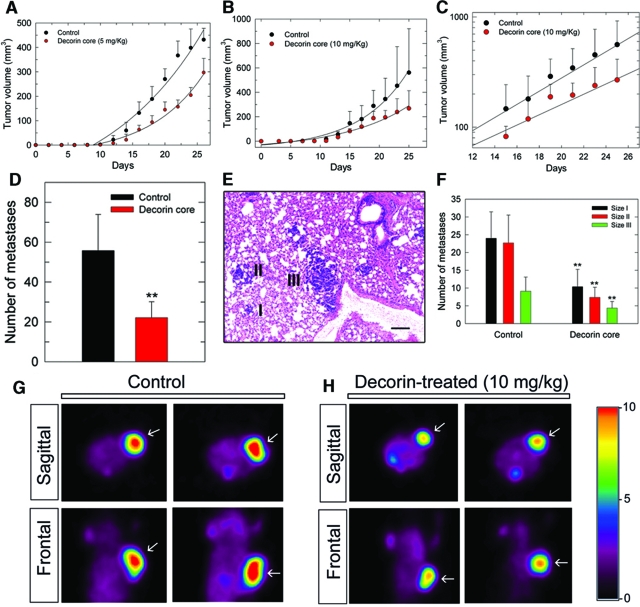
Decorin, a member of the small leucine-rich proteoglycan gene family, down-regulates members of the ErbB receptor tyrosine kinase family and attenuates their signaling, leading to growth inhibition. We investigated the effects of decorin on the growth of ErbB2-overexpressing mammary carcinoma cells in comparison with AG879, an established ErbB2 kinase inhibitor. Cell proliferation and anchorage-independent growth assays showed that decorin was a potent inhibitor of breast cancer cell growth and a pro-apoptotic agent. When decorin and AG879 were used in combination, the inhibitory effect was synergistic in proliferation assays but only additive in both colony formation and apoptosis assays. Active recombinant human decorin protein core, AG879, or a combination of both was administered systemically to mice bearing orthotopic mammary carcinoma xenografts. Primary tumor growth and metabolism were reduced by approximately 50% by both decorin and AG879. However, no synergism was observed in vivo. Decorin specifically targeted the tumor cells and caused a significant reduction of ErbB2 levels in the tumor xenografts. Most importantly, systemic delivery of decorin prevented metastatic spreading to the lungs, as detected by novel species-specific DNA detection and quantitative assays. In contrast, AG879 failed to have any effect. Our data support a role for decorin as a powerful and effective therapeutic agent against breast cancer due to its inhibition of both primary tumor growth and metastatic spreading.


Figures

Figure 1
Figure 1
Synergistic effects on tumor cell growth by combinatorial treatment with decorin and AG879. A: Dose-effect curve was obtained for AG879 and decorin alone or in combination. The dose ratio used for the combination was 3:1, AG879 to decorin. In this case, the percentage of growth inhibition was plotted against the concentrations of AG879 used in the combinations. Values represent means with their upper 95% confidence intervals. B: Median-effect plot was obtained by plotting the value of log (fa/fu) against log (D). Fa is fraction of cells affected by treatment, whereas Fu is fraction of cells unaffected. D is the dose; log (fa/fu) values obtained for combination treatment are plotted against decorin doses used in the combination. Anti-logs of the x axis intercept values signify the potency of each drug, where fa/fu = 1 or log (fa/fu) = 0, gives their ED50 value. C: Isobologram using ED30, ED50, and ED60 values of decorin and AG879 as indicated on the X- and Y-axes, respectively. Concentrations of decorin and AG879 in combination that induce similar inhibitory effects are plotted to compare with single drug effect. Note that all of the obtained values fall to the left of the lines (arrows) defined by the concentration of single agents which represent additive effect. D: Combination index values of AG879 and decorin at a 3:1 ratio were plotted against their fractional effect. Combination index value of 1, <1, or >1 signifies an additive, synergistic or antagonistic effect, respectively. In all experiments growth inhibition of MTLn3 cells treated for 48 hours with decorin, AG879 or in combination was measured by cell count (n = 3 to 12).
Figure 2
Figure 2
Inhibition of tumor cell colony formation and size by decorin and AG879 alone or in combination. A: MTLn3 cell colonies grown in soft agarose for 10 days in the presence or absence of the designated agents. Plates were treated with 1.04 μmol/L decorin, 3.16 μmol/L AG879 alone, or 1.04 μmol/L decorin and 3.16 μmol/L AG879, in combination. Photos are representative of each condition. Scale bar = 200 μm. B: Total number of colonies counted per photographic field. Each field is approximately 3.75 mm2 of culture dish. Values represent means with their upper 95% confidence intervals (***P < 0.001, n = 6). C: Average colony size on the indicated treatment. Colony areas were measured with ImageJ software. Values represent means with their upper 95% confidence intervals (***P < 0.001, n = 6). D: Distribution of colonies size following the specified treatment. Size I = 50 to 70 μm, Size II = 70 to 100 μm and Size III >100 μm. All data were collected from two independent experiments. Within each experiment, each treatment was run in triplicate. P values of each treatment are relative to the control value.
Figure 3
Figure 3
Effect of decorin, AG879, and the combination on apoptosis. A, B: MTLn3 cells were left untreated or treated with 1.04 μmol/L decorin for 48 hours before 4′-6-diamindino-2-phenylindole staining. Arrows indicate apoptotic bodies. Scale bar = 60 μm. C: Quantification of percentage of apoptotic bodies from two independent experiments. Each condition n = 30 (***P < 0.001). D: Percentage of apoptotic cells measured by fluorescence-activated cell sorting/DNA fragmentation analysis. MTLn3 cells were exposed to ED50 of decorin, AG879 (1.04 and 3.16 μmol/L, respectively) or their combination for 48 hours, as indicated, and stained with propidium iodide. Data were collected from three independent experiments and each condition was performed in triplicate. Values represent means with their upper 95% confidence intervals (**P < 0.01, ***P < 0.001, n = 9).
Figure 4
Figure 4
Effects of decorin on orthotopic mammary adenocarcinoma growth, metastatic spreading, and metabolism. A: Growth of MTLn3 tumor xenografts in severe-combined immunodeficient mice treated with decorin (5 mg/kg) or vehicle (PBS). Treatment was started at day 4 post-tumor cell injections. At day 12 tumor diameters were measurable by caliper and converted to volumes using the equation a (b2/2), where a and b represent the larger and smaller diameters, respectively. Measurements were taken every other day. Data were collected from three independent experiments and represent means with their upper 95% confidence intervals (n = 12 control, n = 11 decorin-treated). The effect of decorin on tumor growth was statistically validated by two-way RM analysis of variance. Treatment effect P = 0.0006; sampling time effect P < 0.001; treatment × sampling time effect P < 0.001; difference in mean tumor volume on the last experimental day = 134.6 mm3, mean control tumor volume = 431.5 mm3, mean decorin-treated tumor volume = 296.9 mm3, 95% CI = 238.7 to 355.1, P = 0.003. B: Same experiment as in A using double amount of decorin (10 mg/kg). Data were collected from one experiment and represent means with their upper 95% confidence intervals (n = 4 control, n = 5 decorin-treated). Treatment effect P = 0.031; sampling time effect P < 0.001; treatment × sampling time effect P < 0.001; difference in mean tumor volume on the last experimental day = 293 mm3, mean control tumor volume = 561.9 mm3, mean decorin-treated tumor volume = 268.9 mm3, 95% CI = 124.3 to 413.5, P = 0.063. C: Same data as in B (from day 15) presented by linear regression. D–F: Quantitative analysis of pulmonary metastasis number and size. Lungs were perfused-fixed with 10% buffered formaldehyde, paraffin-embedded, sectioned at multiple levels (10 levels every 50 μm), and stained with H&E to visualize metastases (blue nodules stained differentially from surrounding lung tissue). Size I = 50 to 70 μm, Size II = 70 to 100 μm, Size III = > 100 μm. Data represent means with their upper 95% confidence intervals (n = 10 control, n = 8 decorin-treated, **P < 0.01). Scale bar = 40 μm. G–H: Sagittal and frontal PET scan images of two control and two decorin-treated tumors. Notice the marked reduction in metabolism in the treated tumors (arrows). For signal intensity refer to the scale bar on the right.
Figure 5
Figure 5
Effects of decorin on breast tumor growth and metabolism as compared with AG879. A: Growth of MTLn3 orthotopic tumor xenografts in severe-combined immunodeficient mice treated every other day with decorin (3 mg/kg), AG879 (20 mg/kg), both AG879 and decorin (at the same dosage as when used alone), or Trappsol. Treatments were started at day 4 post-tumor cell injections (P = 0.003). Decorin group: treatment effect P = 0.006; sampling time effect P < 0.001; treatment × sampling time effect P < 0.001; difference in mean tumor volume on the last experimental day = 243.7 mm3, mean control tumor volume = 532.3 mm3, mean decorin-treated tumor volume = 288.6 mm3, 95% CI = 240.7 to 336.5, P = 0.005. AG879 group: treatment effect P = 0.005; sampling time effect P < 0.001; treatment × sampling time effect P < 0.001; difference in mean tumor volume on the last experimental day = 248.7 mm3, mean control tumor volume = 532.3 mm3, mean AG879-treated tumor volume = 283.6 mm3, 95% CI = 226 to 341.2 P = 0.004. Combination group: treatment effect P = 0.001; sampling time effect P < 0.001; treatment × sampling time effect P < 0.001; difference in mean tumor volume on the last experimental day = 266.4 mm3, mean control tumor volume = 532.3 mm3, mean combination-treated tumor volume = 265.9 mm3, 95% CI = 202 to 329.8, P = 0.003. B: Sagittal and frontal PET scan images of representative tumors as indicated. For signal intensity refer to the scale bar on the right. Arrows point to the tumor xenografts. C: Fluorescence microscopy images of one control and one decorin-treated tumor. Frozen sections were double-stained with an anti-CD31 antibody to visualize blood vessels (red) and an anti-His antibody to detect recombinant decorin within the tumor tissue (green). Scale bar = 150 μm. Arrows point to intense deposits of decorin.
Figure 6
Figure 6
In vivo down-regulation of ErbB2 receptor by decorin. A,B: Immunohistochemical analysis of MTLn3 vehicle- and decorin-treated tumor using an anti-ErbB2 antibody (green, arrows) and 4′-6-diamindino-2-phenylindole (blue). Scale bar = 100 μm. C,D: Three-dimensional surface plot images as determined by ImageJ software analysis of fluorescence intensity of the FITC channel. E: Quantification of fluorescence intensity representing the expression of ErbB2 in various tumor sections from control and decorin-treated mouse. Values represent means with their upper 95% confidence intervals (n = 30, ***P < 0.001).
Figure 7
Figure 7
Decorin-mediated suppression of metastatic spreading to the lungs. A: Photomicrographs of pulmonary metastases (arrows) from representative mice treated as indicated. The arrows indicate the metastatic nodules. Scale bar = 200 μm. B: Quantification of pulmonary metastases in each treatment group, as indicated. Values represent the means with their upper 95% confidence intervals (n = 5, *P < 0.05, **P < 0.01). Five lungs per treatment group were collected and from each lung 10 sections, 10 μm apart, were obtained. Metastases were counted from each section. C: Agarose gel of a representative PCR of mouse and rat DNA (mDNA and rDNA, respectively) using primers specific for the rat vomeronasal receptors (V1rm3 and V1rm4). The rat-derived (MTLn3) product is a 645-bp band (lane 2), while the 900-bp band is mouse-derived and serves as loading control (lane 1). Lanes 3–5 represent different ratios of mDNA/rDNA: 50/50, 50/10, and 50/1 ng, respectively. D: PCR for rat vomeronasal receptors of control and various treatments as indicated. Arrow indicates the 645-bp band specific for rat DNA, which represents MTLn3-derived DNA within the mouse lung. E: Quantification of metastatic pulmonary burden from lung tissue using the PCR approach described in (D). Bar graph was obtained by normalizing mean absorbance units of rat DNA over mouse DNA. Values represent means with their upper 95% confidence intervals (n = 5, **P < 0.01).

References

    1. Iozzo RV. The family of the small leucine-rich proteoglycans: key regulators of matrix assembly and cellular growth. Crit Rev Biochem Mol Biol. 1997;32:141–174. - PubMed
    1. Hocking AM, Shinomura T, McQuillan DJ. Leucine-rich repeat glycoproteins of the extracellular matrix. Matrix Biol. 1998;17:1–19. - PubMed
    1. Iozzo RV. The biology of the small leucine-rich proteoglycans. Functional network of interactive proteins. J Biol Chem. 1999;274:18843–18846. - PubMed
    1. Reed CC, Iozzo RV. The role of decorin in collagen fibrillogenesis and skin homeostasis. Glycoconj J. 2003;19:249–255. - PubMed
    1. Iozzo RV. Matrix proteoglycans: from molecular design to cellular function. Annu Rev Biochem. 1998;67:609–652. - PubMed

Publication types

MeSH terms