Comparative Study
. 2008 Aug 8;4(8):e1000149.
doi: 10.1371/journal.pgen.1000149.

High-resolution mapping of gene expression using association in an outbred mouse stock

Affiliations
Comparative Study

High-resolution mapping of gene expression using association in an outbred mouse stock

Anatole Ghazalpour et al. PLoS Genet. .

Abstract

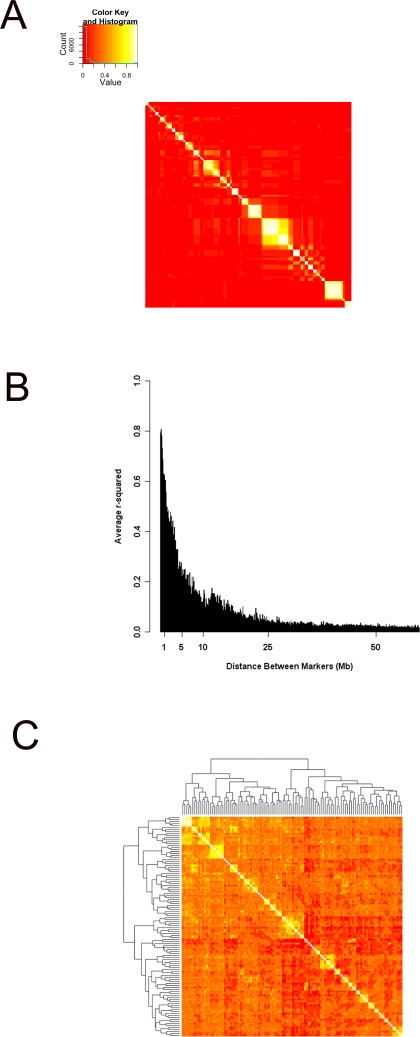
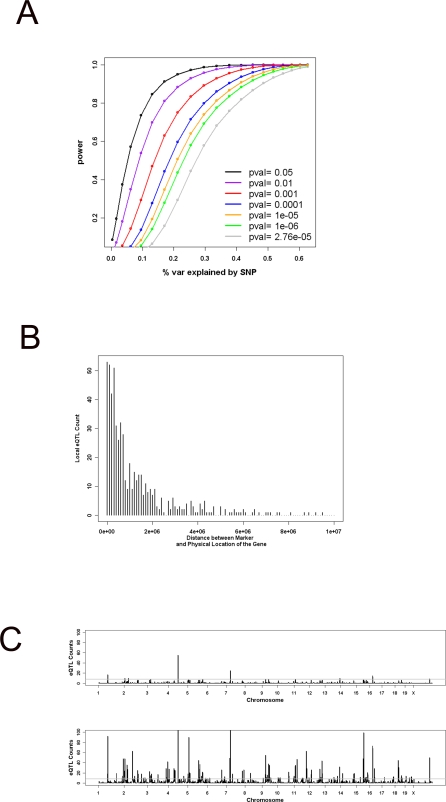
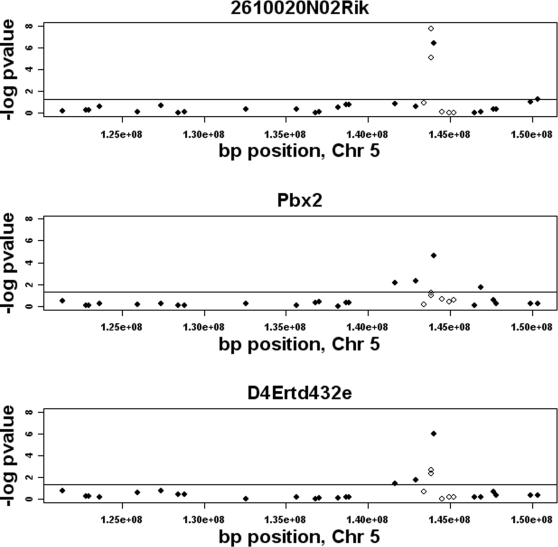
Quantitative trait locus (QTL) analysis is a powerful tool for mapping genes for complex traits in mice, but its utility is limited by poor resolution. A promising mapping approach is association analysis in outbred stocks or different inbred strains. As a proof of concept for the association approach, we applied whole-genome association analysis to hepatic gene expression traits in an outbred mouse population, the MF1 stock, and replicated expression QTL (eQTL) identified in previous studies of F2 intercross mice. We found that the mapping resolution of these eQTL was significantly greater in the outbred population. Through an example, we also showed how this precise mapping can be used to resolve previously identified loci (in intercross studies), which affect many different transcript levels (known as eQTL "hotspots"), into distinct regions. Our results also highlight the importance of correcting for population structure in whole-genome association studies in the outbred stock.


Conflict of interest statement

The authors have declared that no competing interests exist.

Figures

Figure 1
Figure 1. LD and population structure in the MF1 population.
Panel (A) shows the LD structure on chromosome 1. The order of markers in the heat map follows the physical location of the marker along the chromosome with the most proximal starting at the bottom and on the right and the most distal marker on the top and on the left. The correspondence between color and r2 is shown in the insert. Panel (B) shows the distribution of r2 values between markers located at various distance from each other. Each bar depicts a 100 kb bin for the distance between marker pairs. The average r2 for marker pairs within 2Mb of each other is 0.58, for markers between 2 to 5 Mb is 0.3, and for markers 5Mb or more away from each other is 0.05. Panel (C) shows the heatmap visualization of genetic similarity between individual mice. The dendograms on the top and on the side of the heat map are based on the hierarchical clustering of genome wide genotype similarity of the 110 MF1 mice.
Figure 2
Figure 2. Power analysis and the genetic architecture of local and distant eQTL.
Panel (A) shows the power calculation performed for genetic background effect of 0.3. Various curve colors represent the power associated with various p-value cutoffs. (grey = 0.05, green = 0.01, orange = 0.001, blue = 0.0001, red = 1e-05, purple = 1e-06, black = 2.76e-05 which is equivalent to the Bonferroni correction). For each calculation, the minor allele frequency is assumed 0.3. Panel (B) shows the distance of the association peak marker from the physical location of the gene for local eQTL identified in the MF1 population. Panel (C) shows the distant eQTL hotspots across the genome before (bottom) and after (top) population correction. The genome is represented as 1287 equally sized bins of 2 Mb. The gray line depicts the 0.05 genome wide significance for eQTL enrichment after Bonferroni correction (p-value of 3.9e-05).
Figure 3
Figure 3. Comparison of four conserved local eQTL mapping results between the MF1 and BxH studies.
In each plot, the black curve depicts the LOD curve in the BxH data, and the gray curve is the association result in the MF1 data. The physical location of the gene is shown by the black box. In each panel, the tick marks on x-axis depicts the physical location of the markers used in the BxH study. A) Ttf2, B) Frzb, C) Insig2, D) Pparg.
Figure 4
Figure 4. Comparison of the three conserved local eQTL on chromosome 6 between the BxH and MF1 studies.
Panel (A) shows the BxH mapping results for Pparg (dashed curve), Cidec (solid curve), and Bcl2l13 (dotted curve). The physical location of Pparg (circle), Cidec (square), and Bcl2l13 (triangle) is shown at the bottom. Panel (B) shows the MF1 results for Pparg (solid triangles with dotted red curve), Cidec (open circles with gray dotted curve), and Bcl2l13 (solid circles with dotted black curve). The physical location of the genes are depicted at the bottom with gray box for Cidec, red box for Pparg, and black box for Bcl2l13. Tick marks on x-axis depict the physical location of the markers in the BxH dataset.
Figure 5
Figure 5. Fine mapping of the distal chromosome 5 locus.
The three distant eQTL 2610020N02Rik (top), Pbx2 (middle), and D4Ertd432e (bottom) were fine mapped by typing additional markers in the region (open circles). Closed circles represent the original markers used in the whole genome association. The horizontal line corresponds to the nominal p-value of 0.05.

References

    1. Cervino AC, Li G, Edwards S, Zhu J, Laurie C, et al. Integrating QTL and high-density SNP analyses in mice to identify Insig2 as a susceptibility gene for plasma cholesterol levels. Genomics. 2005;86:505–517. - PubMed
    1. Karp CL, Grupe A, Schadt E, Ewart SL, Keane-Moore M, et al. Identification of complement factor 5 as a susceptibility locus for experimental allergic asthma. Nat Immunol. 2000;1:221–226. - PubMed
    1. Meng H, Vera I, Che N, Wang X, Wang SS, et al. Identification of Abcc6 as the major causal gene for dystrophic cardiac calcification in mice through integrative genomics. Proc Natl Acad Sci U S A. 2007;104:4530–4535. - PMC - PubMed
    1. Ghazalpour A, Doss S, Sheth SS, Ingram-Drake LA, Schadt EE, et al. Genomic analysis of metabolic pathway gene expression in mice. Genome Biol. 2005;6:R59. - PMC - PubMed
    1. Schadt EE, Monks SA, Drake TA, Lusis AJ, Che N, et al. Genetics of gene expression surveyed in maize, mouse and man. Nature. 2003;422:297–302. - PubMed

Publication types