

Evaluation of between-methods agreement of extracellular water measurements in adults and children
- PMID: 18689366
- PMCID: PMC2752354
- DOI: 10.1093/ajcn/88.2.315
Evaluation of between-methods agreement of extracellular water measurements in adults and children
Abstract
Background: Extracellular water (ECW), a relevant molecular level component for clinical assessment, is commonly obtained by 2 methods that rely on assumptions that may not be possible to test at the time the measurements are made.
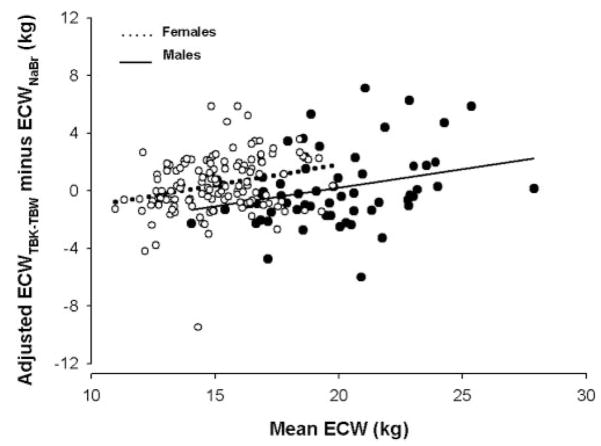
Objective: The aim of the current study was to evaluate the degree of agreement between ECW assessment by the sodium bromide dilution (ECW(NaBr)) and total body potassium (TBK; whole-body (40)K counting) to total body water (TBW; isotope dilution) methods (ECW(TBK-TBW)) in an ethnically mixed group of children and adults.
Design: ECW was measured with the ECW(NaBr) and ECW(TBK-TBW) methods in 526 white and African American males and females (86 nonobese children, 193 nonobese adults, and 247 obese adults). Fat mass was assessed with dual-energy X-ray absorptiometry. Multiple regression analysis was used to examine the variables related to between-ECW method differences.
Results: Significant but generally small group mean (+/-SD) differences in ECW were found in the obese adults (1.28 +/- 2.54 kg) and children (-0.71 +/- 1.78 kg). The magnitude of the differences was related to mean ECW in obese adults, children, and nonobese adults, and the relations between these variables were modified by sex for nonobese adults. ECW differences were also dependent on age, weight, sex, and race or on interactions between these variables.
Conclusions: Overall, although good between-method agreement was found across the 3 groups, the degree of agreement varied according to subject characteristics, particularly at the extremes of ECW and body weight. We advance a possible mechanism that may link subject characteristics with the degree of agreement between ECW measurement methods and their underlying assumptions.
Figures


References
-
- Fomom SJ, Haschke F, Ziegler EE, Nelson SE. Body composition of reference children from birth to age 10 years. Am J Clin Nutr. 1982;35:1169–75. - PubMed
-
- Forbes GB. Human body composition: growth, aging, nutrition, and activity. New York, NY: Springer; 1987.
-
- Silva AM, Wang J, Pierson RN, Jr, et al. Extracellular water: greater expansion with age in African Americans. J Appl Physiol. 2005;99:261–7. - PubMed
-
- Kotler DP, Wang J, Pierson RN. Body composition studies in patients with the acquired immunodeficiency syndrome. Am J Clin Nutr. 1985;42:1255–65. - PubMed
-
- Moore FD, Olesen KH, Parker HV, Ball MR, Boyden CM. The body cell mass and its supporting environment. Philadelphia, PA: Saunders; 1963.
Publication types
MeSH terms
Substances
Grants and funding
LinkOut - more resources
Full Text Sources
Medical
