. 2008 Nov 15;95(10):4584-96.
doi: 10.1529/biophysj.108.129874. Epub 2008 Aug 8.

Receptor actions of synaptically released glutamate: the role of transporters on the scale from nanometers to microns

Affiliations

Receptor actions of synaptically released glutamate: the role of transporters on the scale from nanometers to microns

Kaiyu Zheng et al. Biophys J. .

Abstract

Actions of the excitatory neurotransmitter glutamate inside and outside the synaptic cleft determine the activity of neural circuits in the brain. However, to what degree local glutamate transporters affect these actions on a submicron scale remains poorly understood. Here we focus on hippocampal area CA1, a common subject of synaptic physiology studies. First, we use a two-photon excitation technique to obtain an estimate of the apparent (macroscopic) extracellular diffusion coefficient for glutamate, approximately 0.32 mum(2)/ms. Second, we incorporate this measurement into a Monte Carlo model of the typical excitatory synapse and examine the influence of distributed glutamate transporter molecules on signal transmission. Combined with the results of whole-cell recordings, such simulations argue that, although glutamate transporters have little effect on the activation of synaptic alpha-amino-3-hydroxy-5-methyl-4-isoxazolepropionic acid receptors, this does not rule out the occurrence of up to several dozens of transporters inside the cleft. We further evaluate how the expression pattern of transporter molecules (on the 10-100 nm scale) affects the activation of N-methyl-D-aspartic acid or metabotropic glutamate receptors in the synaptic vicinity. Finally, we extend our simulations to the macroscopic scale, estimating that synaptic activity sufficient to excite principal neurons could intermittently raise extracellular glutamate to approximately 1 muM only at sparse (microns apart) hotspots. Greater rises of glutamate occur only when <5% of transporters are available (for instance, when an astrocyte fails). The results provide a quantitative framework for a better understanding of the relationship between glutamate transporters and glutamate receptor signaling.


Figures
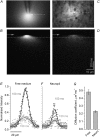
FIGURE 1
FIGURE 1
Measurements of extracellular diffusivity in the CA1 stratum radiatum using two-photon excitation imaging of point-source diffusion. (A and B) Two-photon excitation (790 nm) of Alexa Fluor 350 ejected from a patch pipette (tip diameter ∼1 μm) in a free bath medium, ∼50 μm above the surface of an acute hippocampal slice. (A) A frame scan of fluorescence averaged over 5 s during continuous pressure application; (arrow) line-scan position. (B) A line-scan image (single trial, line position shown by dotted arrow in A, depicting evolution of the fluorescence profile after a 10-ms pressure pulse (arrow); dotted line indicates a brightness sampling line 100 ms post pulse (see below). (C and D) Experiments similar to those in A and B, but in stratum radiatum of the same slice. Dark profiles represent intracellular lumen of large dendrites and cell fragments extending beyond the focal excitation plane. Notations are the same as in A and B. (E and F) Fluorescence line-scan profiles sampled at 100 ms and 150 ms post pulse in a free bath medium and inside the slice neuropil, as indicated. (Gray and light gray dots) Experimental profiles; (black dotted lines) the corresponding theoretical fit obtained using the instantaneous point-source diffusion equation (see Materials and Methods). Note a much slower dissipation of the fluorescence profile with time in the neuropil (F) compared to free medium (E). (G) The average diffusion coefficients for Alexa Fluor 350 in a free medium and in the stratum radiatum neuropil, as indicated (Df = 0.48 ± 0.03 μm2/ms, n = 22; and De = 0.23 ± 0.01 μm2/ms, n = 37, respectively). Bars: average; error bars: mean ± SE.
FIGURE 2
FIGURE 2
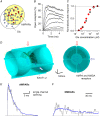
Monte Carlo model of the characteristic Schaffer collateral-CA1 pyramidal cell synapse incorporating unevenly distributed glutamate receptors and transporters. (A–C) A control simulation test verifying that the model reproduces faithfully the results of an experiment in which glutamate was rapidly applied to outside-out patches of CA1 or CA3 pyramidal cells (41). In a cylindrical volume (300 diameter × 300 nm height), 20 AMPARs were scattered arbitrarily over one base side, and glutamate molecules were instantaneously injected (evenly randomly, A) at a concentration of 30, 61, 100, 200, 301, 625, 1000, 3130, and 10000 μM, producing the corresponding current (B, gray trace, response at 10,000 μM). The summary results (C, red circles) match well with the experimental data (open circles) of outside-out patch experiments (41). (D) A diagram illustrating three-dimensional geometry of the modeled synaptic environment; (left) three-fourths view; (right) a projection of the central cross section; arrows depict some intercellular gaps; extrasynaptic membrane regions occupied by transporter molecules are seen. See Materials and Methods for details and model parameters. (E and F) The model outcome illustrating the opening time course for 80 AMPARs (E) and 20 NMDARs (F) expressed within the synaptic active zone, after release of 3000 glutamate molecules at the cleft center. (Gray histograms and blue lines) Single run and the average of 56 runs, respectively. Glutamate diffusion coefficient, 0.4 μm2/ms, to account for extracleft (0.45 μm2/ms) and intracleft (0.33 μm2/ms) diffusivity (see Results).
FIGURE 3
FIGURE 3
Glutamate uptake has no effect on activation of synaptic AMPARs. (A) The number of perisynaptic glutamate transporters (abscissa; see Fig. 2 D for transporter location; EAAT1 kinetics is adopted) has little effect on the amplitude of simulated AMPAR-mediated EPSCs (false color scale, the peak number of open receptors) over a plausible range of the glutamate diffusion coefficient inside the cleft (ordinate). (B) Intrasynaptic glutamate transporters (abscissa; EAAT3 kinetics is adopted), if present, should attenuate AMPAR-dependent EPSCs (color scale), depending on the transporter number, over a range of the glutamate diffusion coefficient inside the cleft (ordinate). (C) Blockade of glutamate uptake with 50 μM TBOA has no detectable effect on miniature AMPAR-dependent responses in CA1 pyramidal cells. (Traces) Representative examples (three consecutive traces overlapped in each panel; Cntrl, control; TBOA, application of TBOA; and Wash, washout). (Plot) Summary; (dots) individual cells; (gray bars) average values; (dotted lines connect data points obtained in the same cell. Average amplitude changes in TBOA and after washout relative to control are, respectively, 1.09 ± 0.06 and 1.04 ± 0.06 (n = 9). (D) Blockade of glutamate uptake with TBOA has no effect on minimal stimulation responses (AMPAR-mediated) in CA1 pyramidal cells. Traces: representative examples in control (black), during TBOA application (red), and during washout (gray; average of 20 traces each). (Plot) Summary; other notations are the same as in C. Average amplitude changes in TBOA and after washout relative to control are, respectively, 1.00 ± 0.06 and 1.07 ± 0.08 (n = 21 and n = 11).
FIGURE 4
FIGURE 4
Extrasynaptic glutamate transporters have little influence on the activation of AMPARs. (A) Locations of the test AMPAR cluster (20 receptors; cluster positions are shown in projection by white circles) relative to the glutamate release site (synaptic cleft center), in two cases: with and without the overlapping transporter-enriched area (upper and lower arrows, respectively). Note that the projection shown masks a significant spherical curvature of the extracellular space (see Fig. 2 D). (B) Time course of the AMPAR opening (proportion of open receptors, %) at the test locations, as indicated (diagram in A), with and without glutamate transporters, a 28-run average. (C) Statistical summary: average charge transfer (n = 28 runs) carried by activated AMPARs at different curvilinear distances from the cleft center, relative to the charge transfer by the AMPARs located in the synaptic cleft center. (Open and solid circles) Data with and without transporters, respectively; yellow and blue shading: synaptic cleft dimensions and the spatial extent of extrasynaptic transporters (when they are present), respectively. A small stochastic error expected in Monte Carlo simulations is not shown. (D) Time course of AMPAR activation (number of receptors out of 80) during repetitive releases of glutamate at 20, 100, and 200 Hz, as indicated by colors; timescales are adjusted to synchronize releases. Transporters added at 200 Hz show little effect on the AMPAR activation (the effect of transporters was negligible at 20 and 100 Hz; data not shown). (E) Time course of AMPAR desensitization in simulation experiments depicted in D. Other notations are as in D.
FIGURE 5
FIGURE 5
Extrasynaptic glutamate transporters reduce activation of nearby NMDARs and mGluRs by synaptically released glutamate. (A) Locations of the test NMDAR cluster (20 receptors; cluster positions are shown in projection by white circles, as in Fig. 4 A). (B) Time course of NMDAR opening (proportion of open receptors, %) at the test locations, as indicated (diagram in A), with and without glutamate transporters, as indicated, 28 run average. (C) Statistical summary of simulations shown in B: average charge transfer carried by activated NMDARs between 0 and 20 ms post release (value relative to the charge transfer by NMDARs located in the synaptic cleft center, with no transporters) at different curvilinear distances from the cleft center. (Open and solid circles) Data with and without transporters, respectively; (yellow and blue shading) synaptic cleft dimensions and the spatial extent of extrasynaptic transporters (when they are present), respectively. A small stochastic error expected in Monte Carlo simulations is not shown. (D) Locations of the test mGluR cluster (20 receptors distributed along synaptic perimeter; cluster positions are shown in projection by white circles, as in A). (E) Time course of mGluR activation (proportion of singly bound receptors, %). Other notations are as in B. (F) Statistical summary of simulations shown in E: a relative decrease of mGluR binding by glutamate in the presence of transporters at different distances from the release site. Other notations are as in C.
FIGURE 6
FIGURE 6
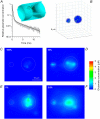
Glutamate transporters and synaptic activity shape the landscape of extracellular glutamate in the CA1 neuropil. (A) Matching the Monte Carlo model of the synaptic environment (Fig. 2 D) and the multicompartmental (macroscopic) model of the neuropil. (Inset) In the Monte Carlo model (geometry shown), the glutamate concentration was averaged over the 0.25-μm cubic volumes (indicated); the concentration time course was compared with that calculated using similar (equiconcentration) compartments of the macroscopic model. The number of released molecules (3000) and the average extracellular concentration of transporters (0.2 mM) were matched. (Plot) Gray and black lines, glutamate concentration time course in the central 0.25-μm volume calculated using, respectively, the Monte Carlo and compartmental models. (B) Three-dimensional impression of the two active synaptic pools in the neuropil. Colors indicate local glutamate concentrations (see C–F below; see text for details). (C–F) Snapshots of the extracellular glutamate concentration landscape in a neuropil cross section through the centers of the two active synaptic pools (B) in different conditions of uptake (indicated by the percentage of the functional glutamate transporters; baseline is 0.2 mM). (False color scale) Concentrations. See Results for details.

Similar articles

Cited by

References

    1. Sah, P., S. Hestrin, and R. A. Nicoll. 1989. Tonic activation of NMDA receptros by ambient glutamate enhances excitability of neurons. Science. 246:815–818. - PubMed
    1. Kamermans, M., and F. Werblin. 1992. GABA-mediated positive autofeedback loop controls horizontal cell kinetics in tiger salamander retina. J. Neurosci. 12:2451–2463. - PMC - PubMed
    1. Eghbali, M., J. P. Curmi, B. Birnir, and P. W. Gage. 1997. Hippocampal GABA(A) channel conductance increased by diazepam. Nature. 388:71–75. - PubMed
    1. Mitchell, S. J., and R. A. Silver. 2003. Shunting inhibition modulates neuronal gain during synaptic excitation. Neuron. 38:433–435. - PubMed
    1. Semyanov, A., M. C. Walker, D. M. Kullmann, and R. A. Silver. 2004. Tonically active GABA A receptors: modulating gain and maintaining the tone. Trends Neurosci. 27:262–269. - PubMed

Publication types

LinkOut - more resources