

Diffusional channeling in the sulfate-activating complex: combined continuum modeling and coarse-grained brownian dynamics studies
- PMID: 18689458
- PMCID: PMC2576392
- DOI: 10.1529/biophysj.108.140038
Diffusional channeling in the sulfate-activating complex: combined continuum modeling and coarse-grained brownian dynamics studies
Abstract
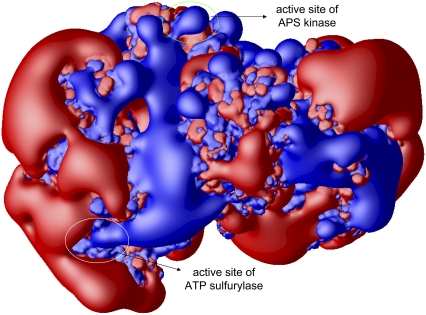
Enzymes required for sulfur metabolism have been suggested to gain efficiency by restricted diffusion (i.e., channeling) of an intermediate APS(2-) between active sites. This article describes modeling of the whole channeling process by numerical solution of the Smoluchowski diffusion equation, as well as by coarse-grained Brownian dynamics. The results suggest that electrostatics plays an essential role in the APS(2-) channeling. Furthermore, with coarse-grained Brownian dynamics, the substrate channeling process has been studied with reactions in multiple active sites. Our simulations provide a bridge for numerical modeling with Brownian dynamics to simulate the complicated reaction and diffusion and raise important questions relating to the electrostatically mediated substrate channeling in vitro, in situ, and in vivo.
Figures


Similar articles
-
Sulfate-activating enzymes in normal and brachymorphic mice: evidence for a channeling defect.Biochemistry. 1995 Jan 24;34(3):940-5. doi: 10.1021/bi00003a028. Biochemistry. 1995. PMID: 7827052
-
Intermediate channeling between ATP sulfurylase and adenosine 5'-phosphosulfate kinase from rat chondrosarcoma.Biochemistry. 1994 Jun 7;33(22):6822-7. doi: 10.1021/bi00188a010. Biochemistry. 1994. PMID: 8204616
-
Crystal structures of the kinase domain of the sulfate-activating complex in Mycobacterium tuberculosis.PLoS One. 2015 Mar 25;10(3):e0121494. doi: 10.1371/journal.pone.0121494. eCollection 2015. PLoS One. 2015. PMID: 25807013 Free PMC article.
-
Sulfate activation and transport in mammals: system components and mechanisms.Chem Biol Interact. 1998 Feb 20;109(1-3):143-51. doi: 10.1016/s0009-2797(97)00129-4. Chem Biol Interact. 1998. PMID: 9566742 Review.
-
Simulation tools for particle-based reaction-diffusion dynamics in continuous space.BMC Biophys. 2014 Oct 24;7:11. doi: 10.1186/s13628-014-0011-5. eCollection 2014. BMC Biophys. 2014. PMID: 25737778 Free PMC article. Review.
Cited by
-
Multiple Scales in the Simulation of Ion Channels and Proteins.J Phys Chem C Nanomater Interfaces. 2010 Oct 21;114(48):20719-20733. doi: 10.1021/jp106760t. J Phys Chem C Nanomater Interfaces. 2010. PMID: 21135913 Free PMC article.
-
Co-localization and confinement of ecto-nucleotidases modulate extracellular adenosine nucleotide distributions.PLoS Comput Biol. 2020 Jun 25;16(6):e1007903. doi: 10.1371/journal.pcbi.1007903. eCollection 2020 Jun. PLoS Comput Biol. 2020. PMID: 32584811 Free PMC article.
-
Multi-Scale Continuum Modeling of Biological Processes: From Molecular Electro-Diffusion to Sub-Cellular Signaling Transduction.Comput Sci Discov. 2012 Mar 20;5(1):015002. doi: 10.1088/1749-4699/5/1/015002. Comput Sci Discov. 2012. PMID: 23505398 Free PMC article.
-
Electrostatic channeling in P. falciparum DHFR-TS: Brownian dynamics and Smoluchowski modeling.Biophys J. 2014 Nov 18;107(10):2394-402. doi: 10.1016/j.bpj.2014.09.039. Biophys J. 2014. PMID: 25418308 Free PMC article.
-
Channeling by Proximity: The Catalytic Advantages of Active Site Colocalization Using Brownian Dynamics.J Phys Chem Lett. 2010 May 6;1(9):1332-1335. doi: 10.1021/jz1002007. Epub 2010 Apr 9. J Phys Chem Lett. 2010. PMID: 20454551 Free PMC article.
References
-
- Huang, X. Y., H. M. Holden, and F. M. Raushel. 2001. Channeling of substrates and intermediates in enzyme-catalyzed reactions. Annu. Rev. Biochem. 70:149–180. - PubMed
-
- Miles, E. W., S. Rhee, and D. R. Davies. 1999. The molecular basis of substrate channeling. J. Biol. Chem. 274:12193–12196. - PubMed
-
- Ushiroyama, T., T. Fukushima, J. D. Styre, and H. O. Spivey. 1992. Substrate channeling of NADH in mitochondrial redox processes. Curr. Top. Cell. Regul. 33:291–307. - PubMed
-
- Rudolph, J., and J. Stubbe. 1995. Investigation of the mechanism of phosphoribosylamine transfer from glutamine phosphoribosylpyrophosphate amidotransferase to glycinamide ribonucleotide synthetase. Biochemistry. 34:2241–2250. - PubMed
Publication types
MeSH terms
Substances
Grants and funding
LinkOut - more resources
Full Text Sources
Miscellaneous
