. 2008 Nov 1;112(9):3788-97.
doi: 10.1182/blood-2008-04-154286. Epub 2008 Aug 8.

Human T-cell leukemia virus type-1 antisense-encoded gene, Hbz, promotes T-lymphocyte proliferation

Affiliations

Human T-cell leukemia virus type-1 antisense-encoded gene, Hbz, promotes T-lymphocyte proliferation

Joshua Arnold et al. Blood. .

Abstract

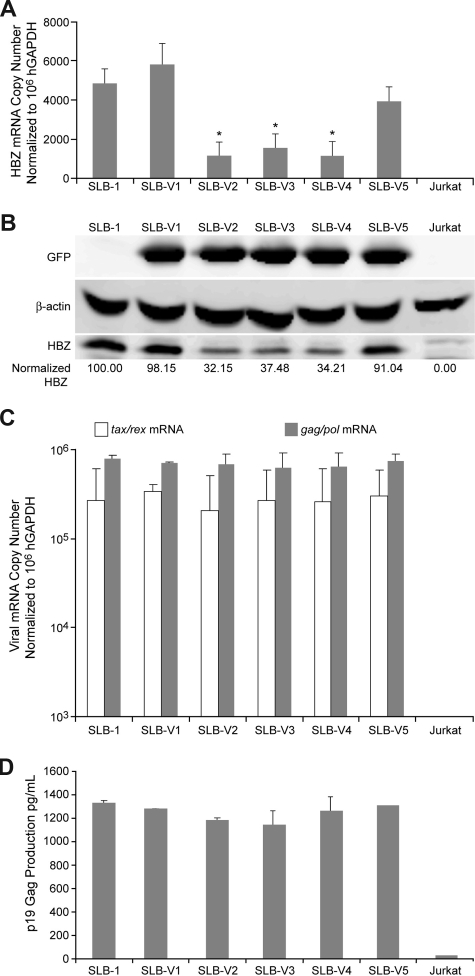
Human T-cell leukemia virus type 1 (HTLV-1) basic leucine zipper factor (HBZ) is dispensable for HTLV-1-mediated cellular transformation in cell culture, but is required for efficient viral infectivity and persistence in rabbits. In most adult T-cell leukemia (ATL) cells, Tax oncoprotein expression is typically low or undetectable, whereas Hbz gene expression is maintained, suggesting that Hbz expression may support infected cell survival and, ultimately, leukemogenesis. Emerging data indicate that HBZ protein can interact with cAMP response element binding protein (CREB) and Jun family members, altering transcription factor binding and transactivation of both viral and cellular promoters. Herein, lentiviral vectors that express Hbz-specific short hairpin (sh)-RNA effectively decreased both Hbz mRNA and HBZ protein expression in transduced HTLV-1-transformed SLB-1 T cells. Hbz knockdown correlated with a significant decrease in T-cell proliferation in culture. Both SLB-1 and SLB-1-Hbz knockdown cells engrafted into inoculated NOD/SCID(gammachain-/-) mice to form solid tumors that also infiltrated multiple tissues. However, tumor formation and organ infiltration were significantly decreased in animals challenged with SLB-1-Hbz knockdown cells. Our data indicate that Hbz expression enhances the proliferative capacity of HTLV-1-infected T cells, playing a critical role in cell survival and ultimately HTLV-1 tumorigenesis in the infected host.


Figures

Figure 1
Figure 1
HTLV-1 genome and detection of Hbz mRNA and protein in HTLV-1 cell lines. (A) HTLV-1 proviral genome highlighting the HTLV-1 protein open reading frames (ORFs). Hbz including the unspliced mRNA transcript and ORF and the major spliced transcript (SP1) and ORF are detailed. Black line denotes mRNA and gray line in SP1 denotes multiple transcription start sites. The location of the Hbz short hairpin target sequences used in this study (Vector 2-4) relative to positive-strand proviral clone numbering is indicated above the Hbz transcript. (B) Total RNA was isolated from HTLV-1 cell lines and negative control Jurkat T cells and subjected to real-time Taqman RT-PCR to quantify the Hbz major spliced transcript (80%-90% of Hbz-specific mRNA,). Copy numbers of Hbz mRNA are normalized to 106 copies of the hGAPDH and the average values from 3 independent experiments are presented; error bars denote SD. Western blot analysis of HBZ protein expression (bottom).
Figure 2
Figure 2
Hbz-specific shRNA lentiviral plasmid vectors knock down HBZ protein expression transiently. 293T cells (105) were cotransfected with 0.2 μg HBZ cDNA expression vector and 1.0 μg shRNA lentiviral vector as indicated (V1-V5). Cellular lysates were harvested at 24- and 48-hour time points and subjected to Western blot analysis to detect HBZ, GFP, and β-actin. β-actin and GFP levels were used as internal loading and transfection normalization controls, respectively.
Figure 3
Figure 3
Characterization of HTLV-1 gene expression in SLB-1 cells stably infected with shRNA lentiviral vectors. (A) Total RNA was isolated from parental SLB-1, stably transduced SLB-1 (V1-V5), and control Jurkat cells and subjected to real-time RT-PCR to quantify Hbz transcripts. Numbers are normalized to 106 copies of hGAPDH. Cells transduced with Hbz-specific shRNA vectors (V2-V4) have a significant 3- to 3.5-fold decrease in Hbz mRNA levels compared with controls (*). (B) Western blot analysis on total cellular lysates from indicated cells shows a significant 3-fold decrease in HBZ protein expression (normalized HBZ densitometry numbers) in cells transduced with Hbz-specific shRNA vectors (V2-V4). Protein reduction correlates directly to mRNA reduction. (C) Quantitation of tax/rex and gag/pol mRNA expression in total cellular RNA by real-time RT-PCR (normalized to 106 hGAPDH) and (D) p19 Gag expression in culture supernatant by ELISA. The data presented in panels A, C, and D are the average values from 3 independent experiments; error bars denote SD. Statistical significance was determined by analysis of variance (ANOVA) followed by Tukey test.
Figure 4
Figure 4
Hbz supports SLB-1 cell proliferation in culture. (A) 103 SLB-1 or stable SLB-1 lentiviral-infected cells (V1-V5) were plated in normal growth medium in 96-well plates and MTS assays were performed on triplicate wells at 24-hour intervals for a total of 5 days. The average absorbance numbers are plotted and error bars denote SD. * denotes the significant difference in proliferation in Hbz-specific shRNA-transduced cells compared with controls. (B) The same cell lines as in panel A were subjected to trypan blue exclusion to assess cell viability. A total of 5 wells per cell line were enumerated per day and presented as average percent of viable cells with error bars denoting SD. (C) Western blot analysis was performed on total cell lysates as indicated. HBZ and Tax levels were quantified and normalized to β-actin control by densitometry. Statistical significance was determined by ANOVA followed by Tukey test.
Figure 5
Figure 5
Hbz supports immortalized T-lymphocyte proliferation in culture. (A) 103 MT-1 and stable MT-1 lentiviral- (V1-V5) infected cells, (B) PBLACH and stable PBLACH lentiviral- (V4 or V5) infected cells, and (C) PBLHTLV-1 and PBLHTLV-1ΔHBZ cells were plated in normal growth medium in 96-well plates and MTS assays were performed on triplicate wells at 24-hour intervals for a total of 5 days. The average absorbance numbers are plotted and error bars denote SD. * denotes the significant difference in proliferation in Hbz-specific shRNA transduced cells or HTLV-1ΔHBZ–infected cells compared with controls or wild-type infected cells. Statistical significance was determined by ANOVA followed by Tukey test.
Figure 6
Figure 6
SLB-1 Hbz knockdown cell proliferation is significantly reduced in NOG mice. (A) NOG mice were inoculated with 107 parental SLB-1, stable lentiviral-infected SLB-1 derivatives (V4, V5), or Jurkat cell control (5 mice each). Because SLB-1 secretes IL-2Rα, mouse serum levels of IL-2Rα were measured by ELISA as a biomarker for SLB-1 proliferation in vivo. Each dot represents the average absorbance value of a single inoculated mouse at 0, 7, 15, and 22 days after inoculation within each group. The horizontal line represents the average of the mouse group at each weekly time point and the dotted line represents negative absorbance values. * denotes significant differences from controls. Statistical significance was determined by ANOVA followed by Tukey test. (B) Western blot analysis was performed on total tumor cell lysates of individual mice as indicated. HBZ and Tax levels were quantified and normalized to β-actin control by densitometry. Statistical significance was determined by ANOVA followed by Tukey test. (C) Immunohistochemistry was performed on representative mouse liver tissue stained for Ki67 human antigen, a marker for proliferation. The glass slides were digitally scanned and captured at 40× magnification using the Aperio ScanScope and ImageScope Software (Aperio Technologies. Vista, CA). Average liver counts for each group are: SLB-1, 389.25 (n = 4); SLB-V4, 97.75 (n = 4); and SLB-V5, 358.6 (n = 5).

References

    1. Lairmore M, Franchini G. Human T-cell leukemia virus types 1 and 2. In: Fields B, Knipe D, Howley P, et al., editors. Fields Virology. Vol. 5. Philadelphia, PA: Lippincott Williams and Wilkins; 2007. pp. 2071–2106. Chapter 56.
    1. Matsuoka M, Jeang KT. Human T-cell leukaemia virus type 1 (HTLV-1) infectivity and cellular transformation. Nat Rev Cancer. 2007;7:270–280. - PubMed
    1. Feuer G, Green PL. Comparative biology of human T-cell lynphotropic virus type 1 (HTLV-1) and HTLV-2. Oncogene. 2005;24:5996–6004. - PMC - PubMed
    1. Bartoe JT, Albrecht B, Collins ND, et al. Functional role of pX open reading frame II of human T-lymphotropic virus type 1 in maintenance of viral loads in vivo. J Virol. 2000;74:1094–1100. - PMC - PubMed
    1. Collins ND, Newbound GC, Albrecht B, Beard J, Ratner L, Lairmore MD. Selective ablation of human T-cell lymphotropic virus type 1 p12I reduces viral infectivity in vivo. Blood. 1998;91:4701–4707. - PubMed

Publication types

MeSH terms