

The basic nonuniformity of the cerebral cortex
- PMID: 18689685
- PMCID: PMC2527956
- DOI: 10.1073/pnas.0805417105
The basic nonuniformity of the cerebral cortex
Abstract
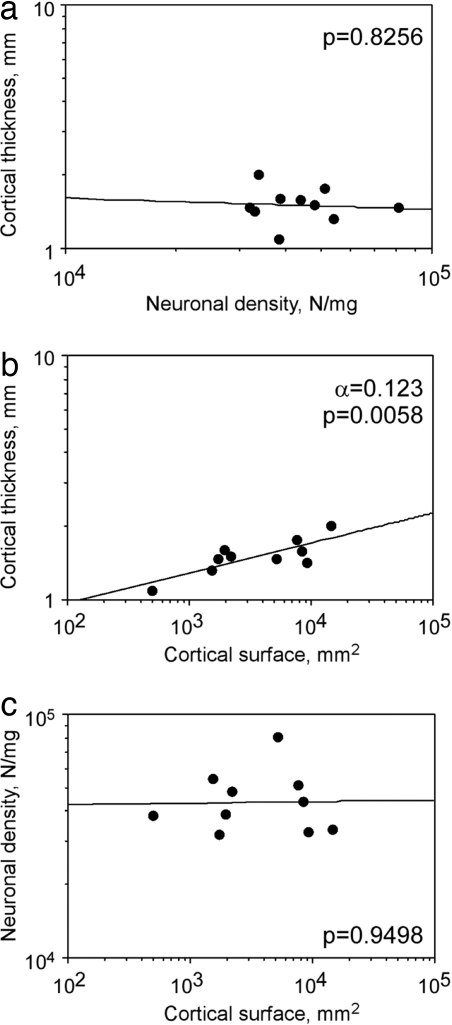
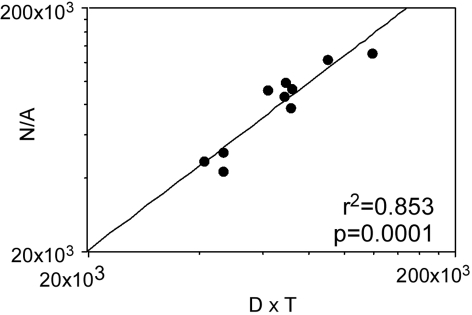
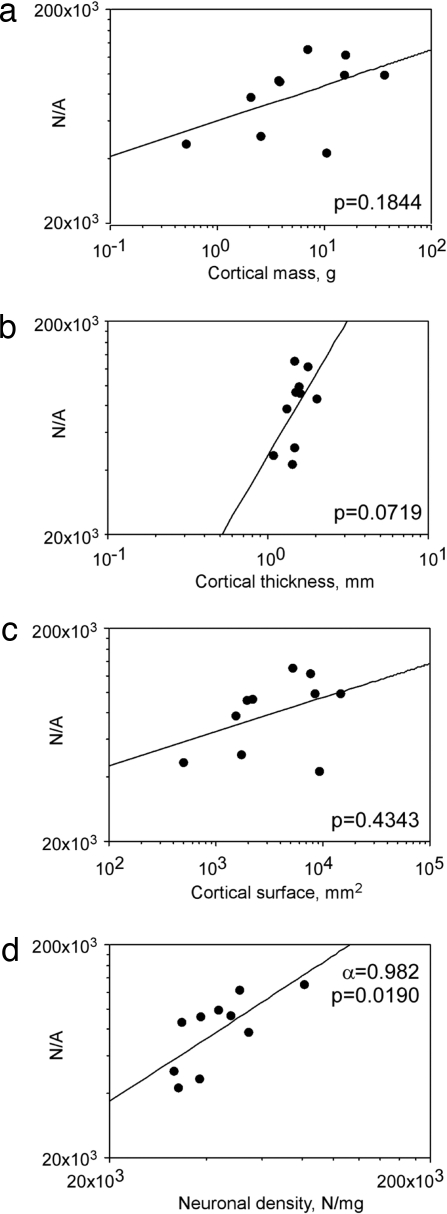
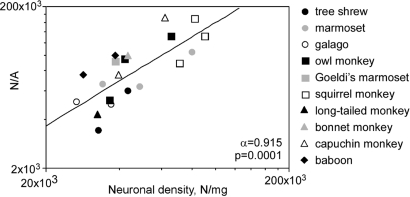
Evolutionary changes in the size of the cerebral cortex, a columnar structure, often occur through the addition or subtraction of columnar modules with the same number of neurons underneath a unit area of cortical surface. This view is based on the work of Rockel et al. [Rockel AJ, Hiorns RW, Powell TP (1980) The basic uniformity in structure of the neocortex. Brain 103:221-244], who found a steady number of approximately 110 neurons underneath a surface area of 750 microm(2) (147,000 underneath 1 mm(2)) of the cerebral cortex of five species from different mammalian orders. These results have since been either corroborated or disputed by different groups. Here, we show that the number of neurons underneath 1 mm(2) of the cerebral cortical surface of nine primate species and the closely related Tupaia sp. is not constant and varies by three times across species. We found that cortical thickness is not inversely proportional to neuronal density across species and that total cortical surface area increases more slowly than, rather than linearly with, the number of neurons underneath it. The number of neurons beneath a unit area of cortical surface varies linearly with neuronal density, a parameter that is neither related to cortical size nor total number of neurons. Our finding of a variable number of neurons underneath a unit area of the cerebral cortex across primate species indicates that models of cortical organization cannot assume that cortical columns in different primates consist of invariant numbers of neurons.
Conflict of interest statement
The authors declare no conflict of interest.
Figures

Comment in
-
Confusing cortical columns.Proc Natl Acad Sci U S A. 2008 Aug 26;105(34):12099-100. doi: 10.1073/pnas.0807271105. Epub 2008 Aug 20. Proc Natl Acad Sci U S A. 2008. PMID: 18715998 Free PMC article. Review. No abstract available.
References
-
- Hofman M. On the evolution and geometry of the brain in mammals. Prog Neurobiol. 1989;32:137–158. - PubMed
-
- Mountcastle VB. In: The Mindful Brain. Schmitt FO, editor. Cambridge, MA: MIT Press; 1978. pp. 7–50.
-
- Hofman MA. Neuronal correlates of corticalization in mammals: a theory. J Theor Biol. 1985;112:77–95. - PubMed
-
- Catania KC, Lyon DC, Mock OB, Kaas JH. Cortical organization in shrews: Evidence from five species. J Comp Neurol. 1999;410:55–72. - PubMed
-
- Szentágothai J. In: The Neurosciences, Fourth Study Program. Schmitt FO, Worden FG, editors. Cambridge, MA: MIT Press; 1979. pp. 399–415.
Publication types
MeSH terms
Grants and funding
LinkOut - more resources
Full Text Sources
