

doi: 10.1093/molbev/msn172.
Epub 2008 Aug 9.
Subdivision in an ancestral species creates asymmetry in gene trees
Affiliations
- PMID: 18689871
- PMCID: PMC2734134
- DOI: 10.1093/molbev/msn172
Item in Clipboard
Subdivision in an ancestral species creates asymmetry in gene trees
Mol Biol Evol.
2008 Oct.
Abstract
We consider gene trees in three species for which the species tree is known. We show that population subdivision in ancestral species can lead to asymmetry in the frequencies of the two gene trees not concordant with the species tree and, if subdivision is extreme, cause the one of the nonconcordant gene trees to be more probable than the concordant gene tree. Although published data for the human-chimp-gorilla clade and for three species of Drosophila show asymmetry consistent with our model, sequencing error could also account for observed patterns. We show that substantial levels of persistent ancestral subdivision are needed to account for the observed levels of asymmetry found in these two studies.
Figures

Illustration of the history of speciation and population subdivision for the analytic model developed in the text. Three species, A, B, and C are sampled today. The dashed line indicates a partial barrier to dispersal in the ancestral species. We define the parameter τ to be equal to the ratio of the internal branch (t2 −t3) to the time to the MRCA (t2), τ =(t2 − t3)/t2.

Hypothetical series of events in a geographic region that could lead to the species tree shown in figure 1. The dashed line in the figure represents a partial barrier to dispersal and corresponds to the dashed line in figure 1. The solid lines represent vicariant events that isolate species on either side.
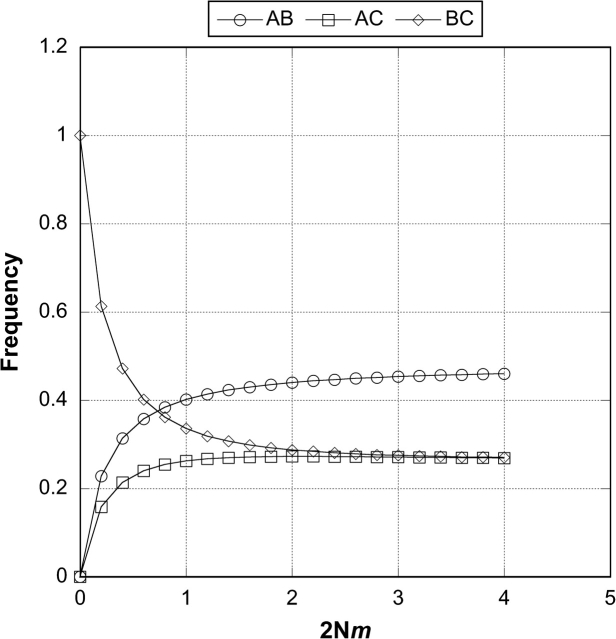
One-locus probabilities of each of the three possible gene trees under the model of ancient subdivision across a range of migration rates. We assume the same population size and migration rate in S4 and S5. These results were obtained by numerical evaluation of equation (4) in the text.

Two-locus simulations using 500,000 replicates were generated using Hudson's (2002) program ms under the demographic model described in figure 1 across a range of plausible recombination rates. The value of τ = 0.2 was used because it is roughly the value for the human–chimp–gorilla clade. Migration was enforced at the speciation event leading to species A and B and persisted at a constant rate back into the common ancestor of all three species. The function f is defined by equation (5) in the text.
References
-
- Aquadro CF, DuMont VB, Reed FA. Genome-wide variation in the human and fruitfly: a comparison. Curr Opin Genet Dev. 2001;11:627–634. - PubMed
-
- Hudson RR. Testing the constant-rate neutral allele model with protein sequence data. Evolution. 1983;37:203–217. - PubMed
-
- Hudson RR. Generating samples under a Wright-Fisher neutral model of genetic variation. Bioinformatics. 2002;18:337–338. - PubMed
Publication types
MeSH terms
Grants and funding
LinkOut - more resources
Full Text Sources
Molecular Biology Databases
