

Developmental and environmental signals induce distinct histone acetylation profiles on distal and proximal promoter elements of the C4-Pepc gene in maize
- PMID: 18689888
- PMCID: PMC2516067
- DOI: 10.1534/genetics.108.087411
Developmental and environmental signals induce distinct histone acetylation profiles on distal and proximal promoter elements of the C4-Pepc gene in maize
Abstract
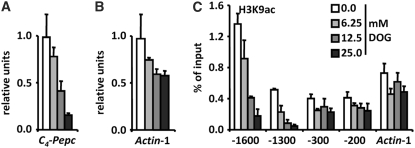
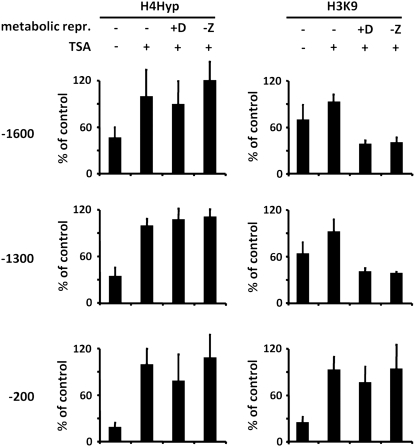
The maize C(4)-Pepc gene is expressed in an organ- and cell-type-specific manner, inducible by light and modulated by nutrient availability and the metabolic state of the cell. We studied the contribution of histone acetylation at five lysine residues to the integration of these signals into a graduated promoter response. In roots and coleoptiles, where the gene is constitutively inactive, three of the five lysines were acetylated and the modifications showed unique patterns with respect to their distribution on the gene. A similar pattern was observed in etiolated leaves, where the gene is poised for activation by light. Here, illumination selectively induced the acetylation of histone H4 lysine 5 and histone H3 lysine 9 in both the promoter and the transcribed region, again with unique distribution patterns. Induction was independent of transcription and fully reversible in the dark. Nitrate and hexose availability modulated acetylation of all five lysines restricted to a distal promoter region, whereas proximal promoter acetylation was highly resistant to these stimuli. Our data suggest that light induction of acetylation is controlled by regulating HDAC activity, whereas metabolic signals regulate HAT activity. Acetylation turnover rates were high in the distal promoter and the transcribed regions, but low on the proximal promoter. On the basis of these results, we propose a model with three levels of stimulus-induced histone modifications that collectively adjust promoter activity. The results support a charge neutralization model for the distal promoter and a stimulus-mediated, but transcription-independent, histone acetylation pattern on the core promoter, which might be part of a more complex histone code.
Figures


Similar articles
-
A Common histone modification code on C4 genes in maize and its conservation in Sorghum and Setaria italica.Plant Physiol. 2013 May;162(1):456-69. doi: 10.1104/pp.113.216721. Epub 2013 Apr 5. Plant Physiol. 2013. PMID: 23564230 Free PMC article.
-
Illumination is necessary and sufficient to induce histone acetylation independent of transcriptional activity at the C4-specific phosphoenolpyruvate carboxylase promoter in maize.Plant Physiol. 2006 Jul;141(3):1078-88. doi: 10.1104/pp.106.080457. Epub 2006 May 5. Plant Physiol. 2006. PMID: 16679423 Free PMC article.
-
Developmental information but not promoter activity controls the methylation state of histone H3 lysine 4 on two photosynthetic genes in maize.Plant J. 2008 Feb;53(3):465-74. doi: 10.1111/j.1365-313X.2007.03352.x. Epub 2008 Jan 4. Plant J. 2008. PMID: 18179650
-
Histone Acetylation Enzymes Coordinate Metabolism and Gene Expression.Trends Plant Sci. 2015 Oct;20(10):614-621. doi: 10.1016/j.tplants.2015.07.005. Trends Plant Sci. 2015. PMID: 26440431 Review.
-
Elongator: an ancestral complex driving transcription and migration through protein acetylation.J Biomed Biotechnol. 2011;2011:924898. doi: 10.1155/2011/924898. Epub 2011 Jan 12. J Biomed Biotechnol. 2011. PMID: 21274405 Free PMC article. Review.
Cited by
-
Mass spectrometry analysis of the variants of histone H3 and H4 of soybean and their post-translational modifications.BMC Plant Biol. 2009 Jul 31;9:98. doi: 10.1186/1471-2229-9-98. BMC Plant Biol. 2009. PMID: 19643030 Free PMC article.
-
H3K4/K9 acetylation and Lr28-mediated expression of six leaf rust responsive genes in wheat (Triticum aestivum).Mol Genet Genomics. 2019 Feb;294(1):227-241. doi: 10.1007/s00438-018-1500-z. Epub 2018 Oct 8. Mol Genet Genomics. 2019. PMID: 30298213
-
Cis-regulatory sequences in plants: Their importance, discovery, and future challenges.Plant Cell. 2022 Feb 3;34(2):718-741. doi: 10.1093/plcell/koab281. Plant Cell. 2022. PMID: 34918159 Free PMC article. Review.
-
A Common histone modification code on C4 genes in maize and its conservation in Sorghum and Setaria italica.Plant Physiol. 2013 May;162(1):456-69. doi: 10.1104/pp.113.216721. Epub 2013 Apr 5. Plant Physiol. 2013. PMID: 23564230 Free PMC article.
-
Regulation of transcription by the Arabidopsis UVR8 photoreceptor involves a specific histone modification.Plant Mol Biol. 2016 Nov;92(4-5):425-443. doi: 10.1007/s11103-016-0522-3. Epub 2016 Aug 17. Plant Mol Biol. 2016. PMID: 27534420 Free PMC article.
References
Publication types
MeSH terms
Substances
LinkOut - more resources
Full Text Sources
Miscellaneous
