Comparative Study
. 2008 Aug 8:9:379.
doi: 10.1186/1471-2164-9-379.

Comparison of the Agilent, ROMA/NimbleGen and Illumina platforms for classification of copy number alterations in human breast tumors

Affiliations
Comparative Study

Comparison of the Agilent, ROMA/NimbleGen and Illumina platforms for classification of copy number alterations in human breast tumors

L O Baumbusch et al. BMC Genomics. .

Abstract

Background: Microarray Comparative Genomic Hybridization (array CGH) provides a means to examine DNA copy number aberrations. Various platforms, brands and underlying technologies are available, facing the user with many choices regarding platform sensitivity and number, localization, and density distribution of probes.

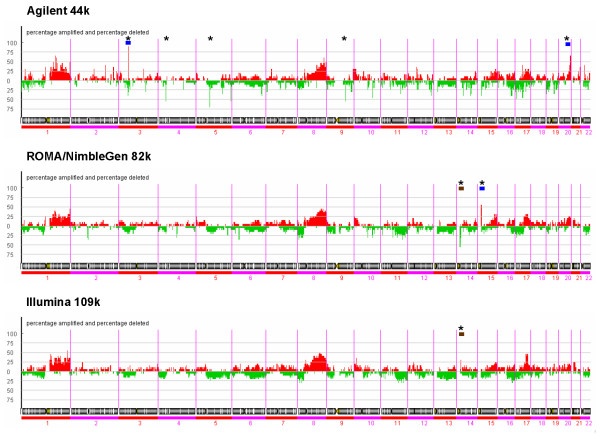
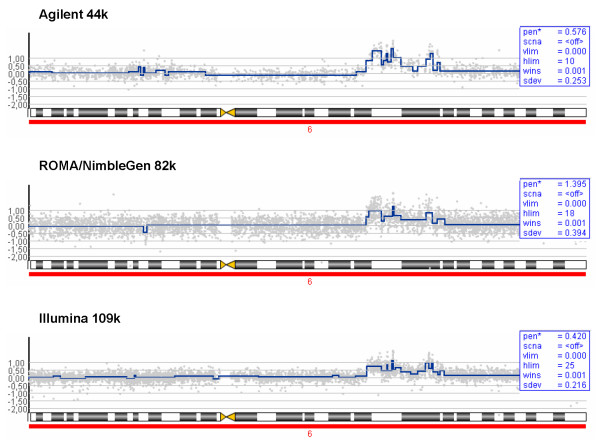
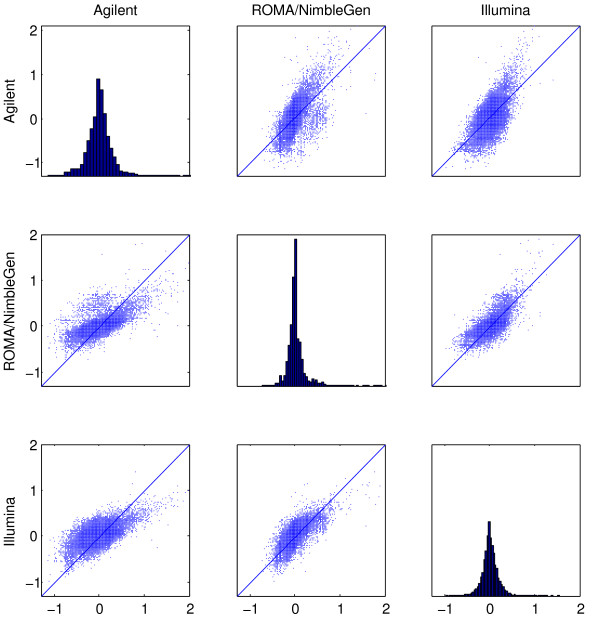
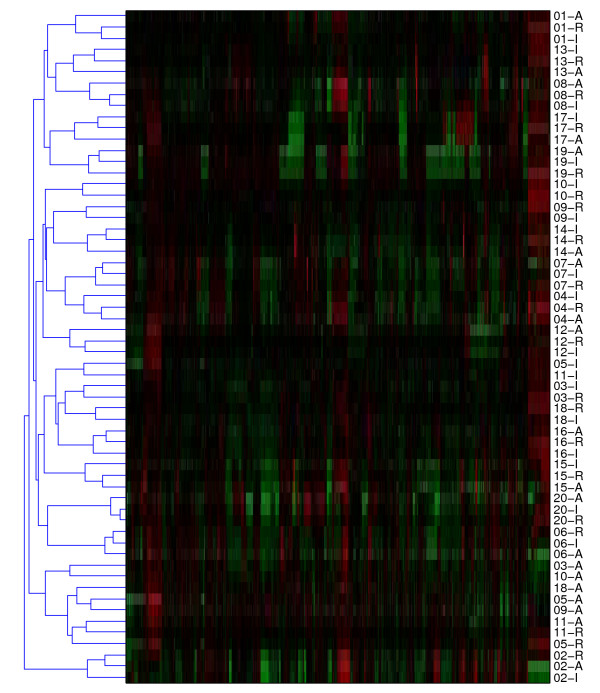
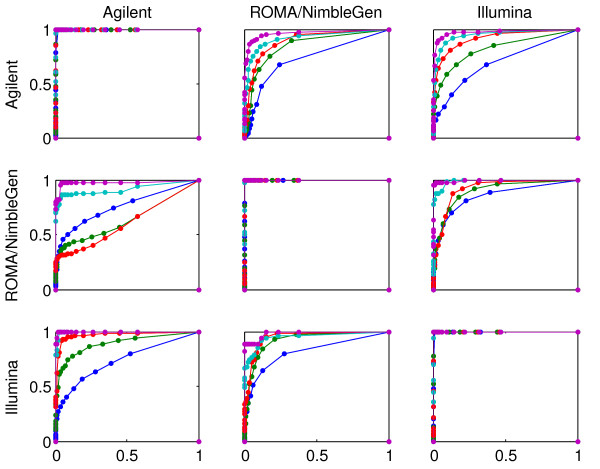
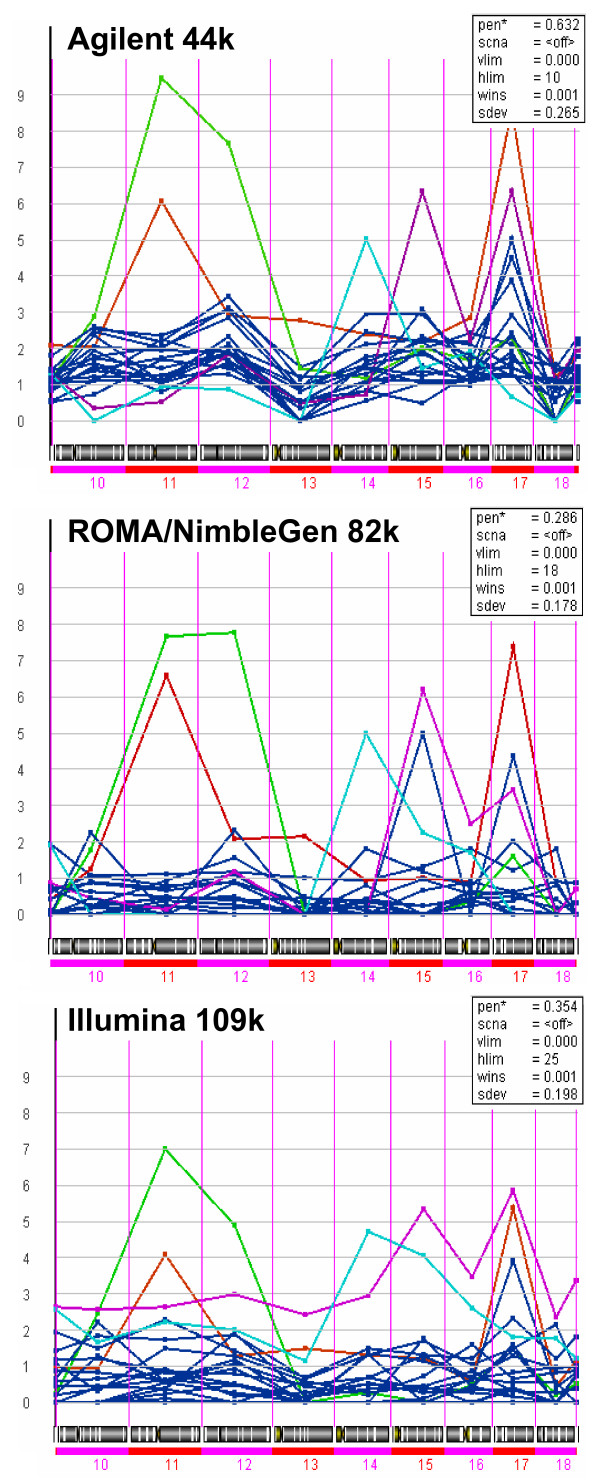
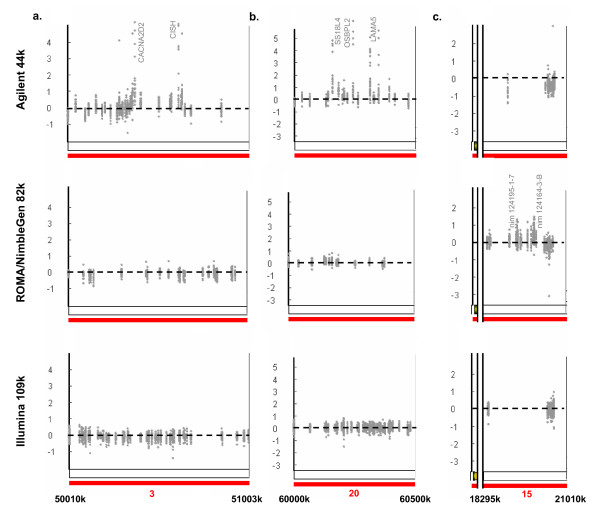
Results: We evaluate three different platforms presenting different nature and arrangement of the probes: The Agilent Human Genome CGH Microarray 44 k, the ROMA/NimbleGen Representational Oligonucleotide Microarray 82 k, and the Illumina Human-1 Genotyping 109 k BeadChip, with Agilent being gene oriented, ROMA/NimbleGen being genome oriented, and Illumina being genotyping oriented. We investigated copy number changes in 20 human breast tumor samples representing different gene expression subclasses, using a suite of graphical and statistical methods designed to work across platforms. Despite substantial differences in the composition and spatial distribution of probes, the comparison revealed high overall concordance. Notably however, some short amplifications and deletions of potential biological importance were not detected by all platforms. Both correlation and cluster analysis indicate a somewhat higher similarity between ROMA/NimbleGen and Illumina than between Agilent and the other two platforms. The programs developed for the analysis are available from http://www.ifi.uio.no/bioinf/Projects/.

Conclusion: We conclude that platforms based on different technology principles reveal similar aberration patterns, although we observed some unique amplification or deletion peaks at various locations, only detected by one of the platforms. The correct platform choice for a particular study is dependent on whether the appointed research intention is gene, genome, or genotype oriented.


Figures

Figure 1
Figure 1
Frequency plot of copy number aberrations. Copy number changes of 20 breast tumors are illustrated using the Piecewise Constant Fit (PCF) method in the CGH-Explorer program. Amplified regions are marked red and deleted regions are marked green. The proportion of calls (all samples combined, and deletions and amplifications combined) was adjusted to 12% (for details see Methods). For every platform, specific high frequency (over 50%) small amplification or deletion peaks are visible (marked by stars *). For the Agilent platform: amplifications at 3p, and 20q, deletions at 4p, twice at 5q, and 9q; for the ROMA/NimbleGen platform: amplifications at 15q and deletions at 14q; the Illumina platform shows lower frequency peaks, but picked up a unique amplification at 14q not seen by the other platforms. (Indicated with blue bars are regions, for which additional information is provided in Figure 7 and in Additional files 8, 11, and 12. Further are indicated with brown bars regions, for which additional information is in Additional files 9 and 10).
Figure 2
Figure 2
Piecewise constant regression for chromosome 6. Detection of genomic aberrations using the PCF method for all platforms, shown for chromosome 6 for patient sample 146. Despite the great similarities in the overall size, structure and amplitude of aberrations, several minor variations are seen.
Figure 3
Figure 3
Scatterplot matrix comparing platforms. Scatterplot matrices for 20 human breast cancer samples are shown for each pair of platforms. The scatterplot matrices are based on the vectors of PCF values. Panels off the diagonal: For each of the 20 samples, PCF values are found for one platform were plotted against values found for another. Abscissa values are for the Agilent 44 k (left column), ROMA/NimbleGen 82 k (middle column) and Illumina 109 k (right column) platforms. Ordinate values are for the Agilent 44 k (top row), ROMA/NimbleGen 82 k (middle row) and Illumina 109 k (bottom row) platforms. Panels on the diagonal: The distribution of the PCF filtered log ratios for all 20 breast cancer samples combined, for the Agilent 44 k (top left panel), ROMA/NimbleGen 82 k (middle panel) and Illumina 109 k (lower right panel) platforms, respectively.
Figure 4
Figure 4
Clustering of 60 arrays representing 20 tumors on 3 platforms. The figure shows the result of clustering the PCF estimated log ratios of 3 × 20 arrays obtained from the 3 platforms used on the 20 tumor samples (for PCF vector calculation see Methods). The samples were clustered using Spearman correlation and average linkage (A = Agilent 44 k, R = ROMA/NimbleGen 82 k, or I = Illumina 109 k). For 14 of the 20 tumors, the three platforms are clustered together at the lowest possible cluster level, for 4 of the remaining tumors, Illumina and ROMA/NimbleGen are clustered together.
Figure 5
Figure 5
ROC curves for aberration calling. ROC curves for the classification of 2936 uniformly spaced genomic loci into three categories (a) deletion, (b) normal and (c) amplified. Using a fixed threshold T across the genome, every locus was called as a deletion if the PCF value was less than -T and as an amplification if the PCF value was larger than T. For every panel in the figure, one of the platforms is chosen as the correct classification (Agilent in row 1, ROMA/NimbleGen in row 2, and Illumina in row 3). The ROC curves show the ability of each of the remaining two platforms to mimic this correct classification. There are four curves in each panel, corresponding to the thresholds T = 0.25, 0.50, 0.75, 1.00 (shown in blue, green, red and cyan, respectively) used to define the correct classification. The points on a ROC curve correspond to different choices of T for the other platform under consideration.
Figure 6
Figure 6
Instability index for chromosome 10 to 18. The instability index, indicating regions of clustered, narrow peaks of chromosomal rearrangements located at a chromosome arm or entire chromosome, was calculated for all samples for all chromosomes. Sample 085 shows highest instability index for chromosome 11 and 12 for all platforms, followed by sample 053 in chromosome 11. For chromosome 14 sample 263 has the highest instability index, for chromosome 15 sample 148. Small differences are seen for chromosome 17, here, the Agilent and ROMA/NimbleGen platforms indicate that sample 053 has the highest index, however, using the Illumina platform, sample 148 has the highest value. (Samples with high instability index (>2) are colored: Sample 053 = red, sample 085 = green, sample 148 = violet, and sample 236 = blue).
Figure 7
Figure 7
Platform differences in narrow frequent amplification peaks. a.) The Agilent platform identifies a small amplification peak at chromosome 3, between 50.36–50.64 Mb (for exact probe localization, aberration calling, reporter coverage and gene identification see Additional file 8). The area is called as amplified using the Agilent platform due to two strongly amplified reporters covering the genes CACNA2D2 (H.s. calcium channel, alpha 2/delta subunit 2) and CISH (H.s. cytokine inducible SH2-containing protein). b.) A larger unique amplification region is detected by the Agilent platform at chromosome 20q, between 60.00–60.50 Mb. Reporters covering SS18L4, OSBPL2, and LAMA5 are highly amplified, causing this region to be called as amplification in the Agilent platform. Reporters in the other platforms either miss these genes or are located nearby at different positions (for exact probe localization, aberration calling, reporter coverage, and gene identification see Additional file 12). c.) The ROMA/NimbleGen platform detects a unique small amplification peak at chromosome 15, between 18.40–20.40 Mb (for details of exact probe localization, aberration calling, reporter coverage and gene identification see Additional file 11), while the Agilent platform has one single reporter and Illumina platform provides only 2 reporters in this specific area, and are therefore unable to detect amplifications in this region.

References

    1. Albertson DG, Collins C, McCormick F, Gray JW. Chromosome aberrations in solid tumors. Nat Genet. 2003;34:369–376. doi: 10.1038/ng1215. - DOI - PubMed
    1. van Beers EH, Nederlof PM. Array-CGH and breast cancer. Breast Cancer Res. 2006;8:210. - PMC - PubMed
    1. Pinkel D, Segraves R, Sudar D, Clark S, Poole I, Kowbel D, et al. High resolution analysis of DNA copy number variation using comparative genomic hybridization to microarrays. Nat Genet. 1998;20:207–211. doi: 10.1038/2524. - DOI - PubMed
    1. Pollack JR, Perou CM, Alizadeh AA, Eisen MB, Pergamenschikov A, Williams CF, et al. Genome-wide analysis of DNA copy-number changes using cDNA microarrays. Nat Genet. 1999;23:41–46. doi: 10.1038/14385. - DOI - PubMed
    1. Snijders AM, Nowak N, Segraves R, Blackwood S, Brown N, Conroy J, et al. Assembly of microarrays for genome-wide measurement of DNA copy number. Nat Genet. 2001;29:263–264. doi: 10.1038/ng754. - DOI - PubMed

Publication types

Substances