. 2008 Sep;15(3):401-415.
doi: 10.1016/j.devcel.2008.07.006. Epub 2008 Aug 7.

Global analysis of the meiotic crossover landscape

Affiliations

Global analysis of the meiotic crossover landscape

Stacy Y Chen et al. Dev Cell. 2008 Sep.

Abstract

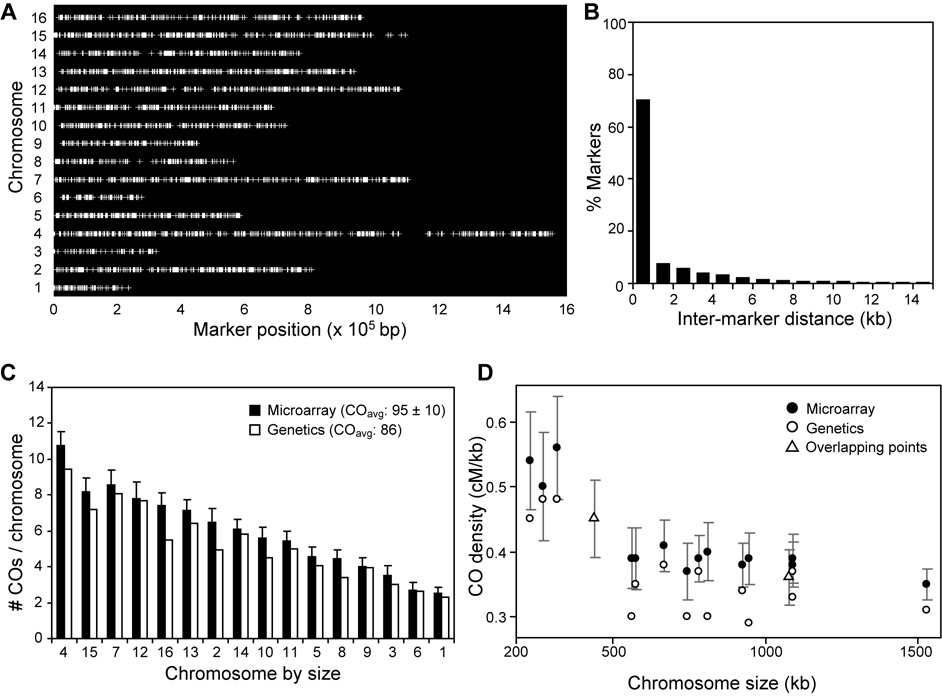
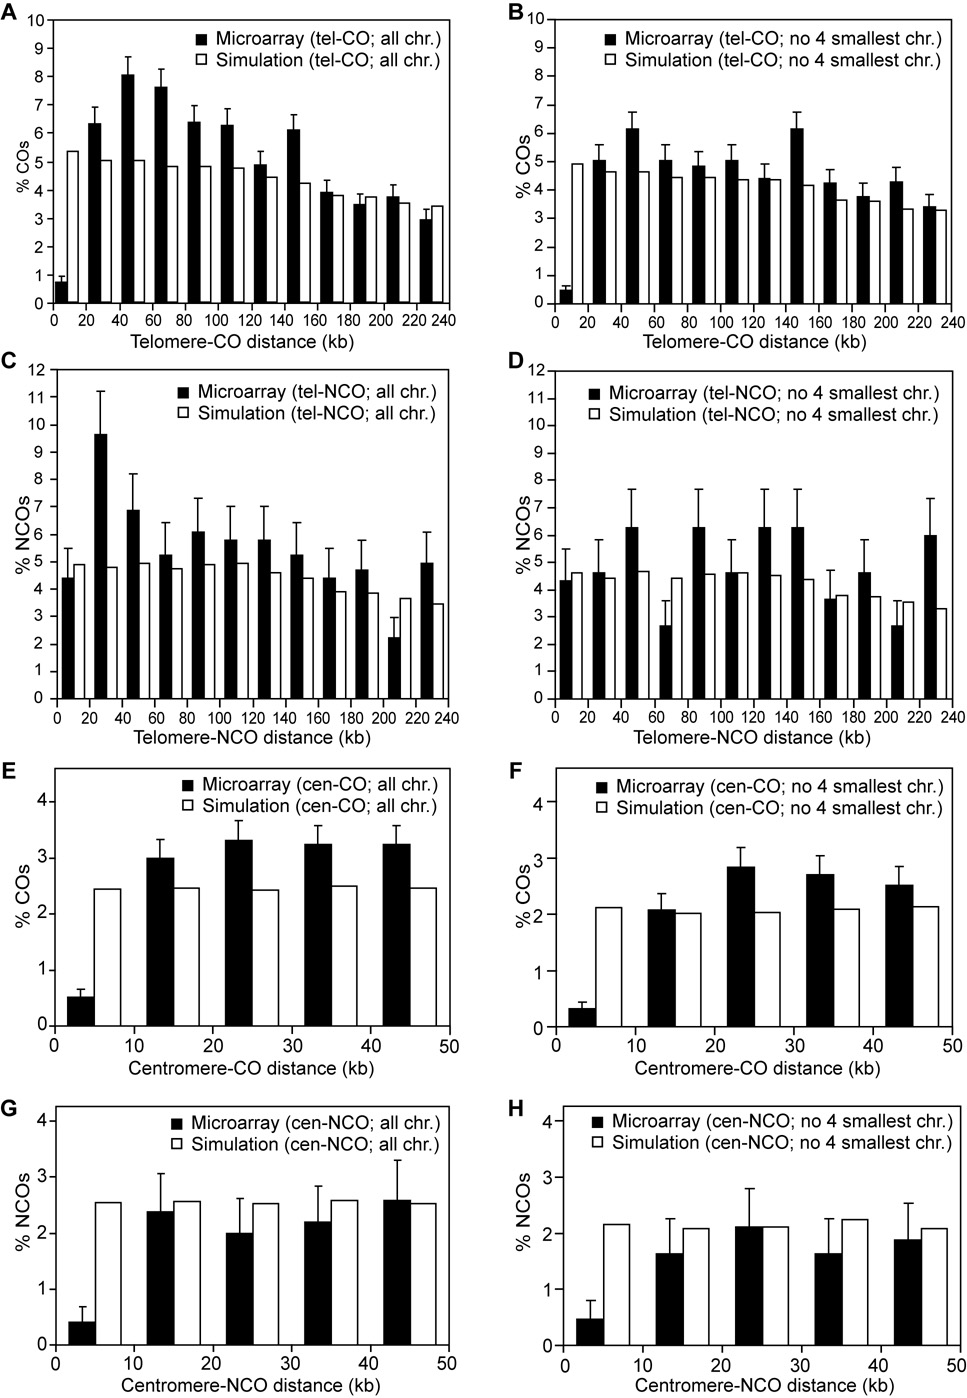
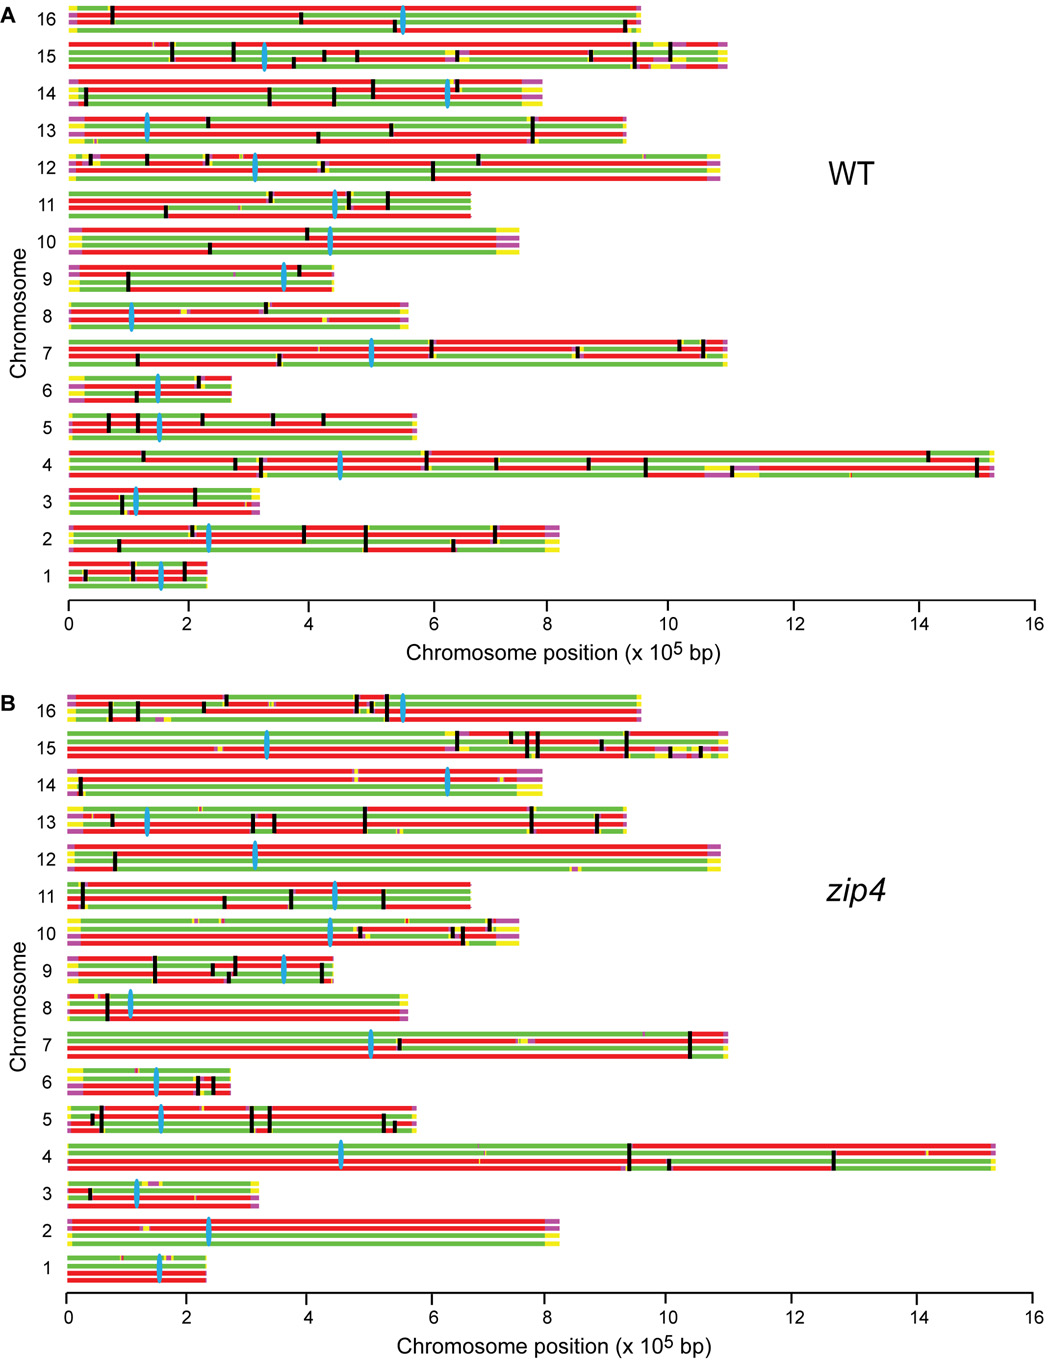
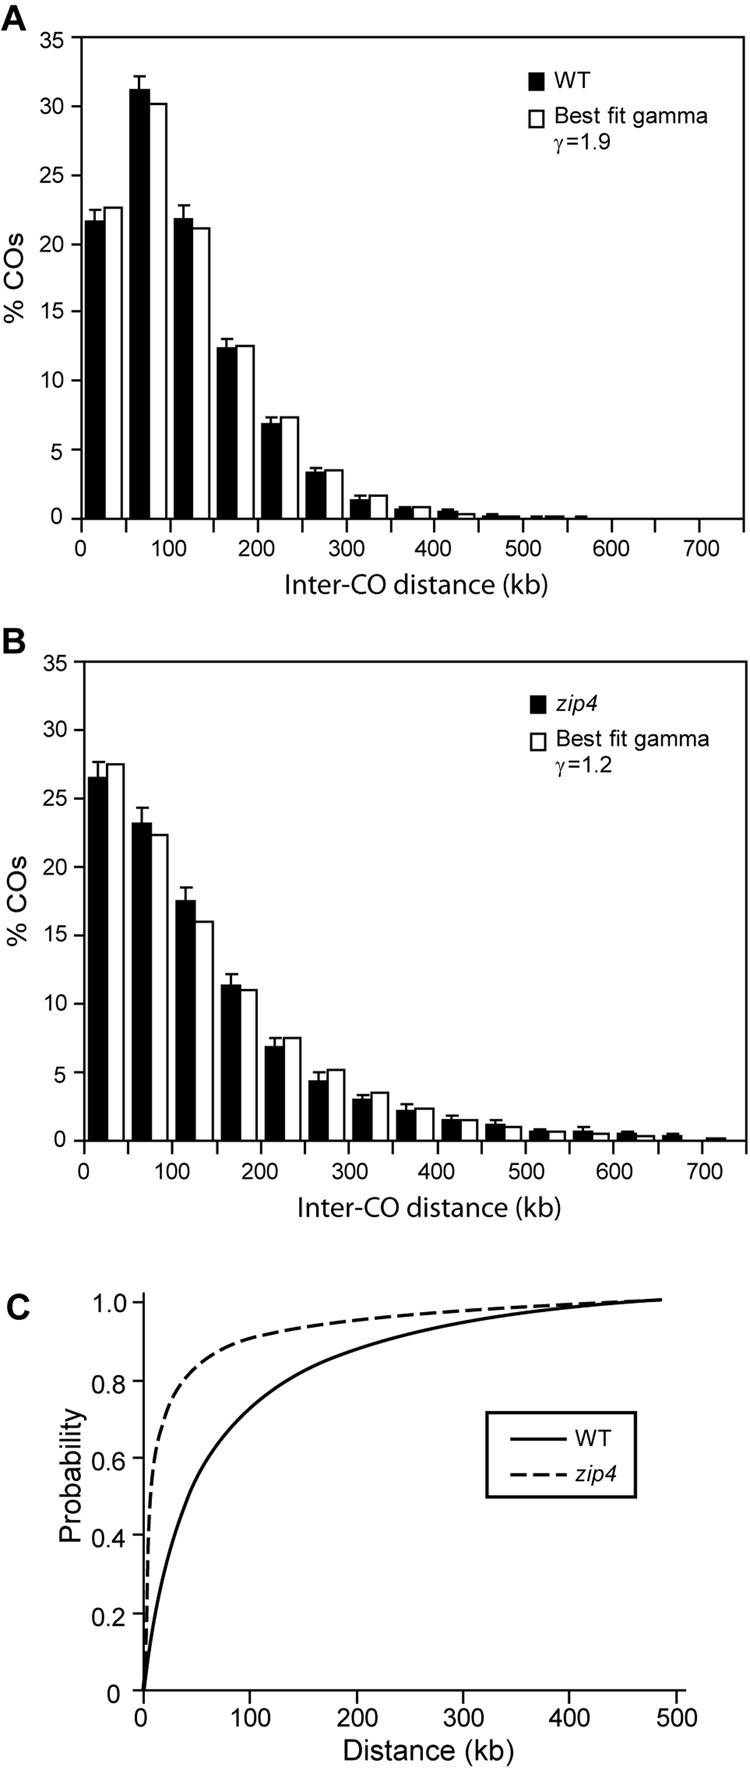
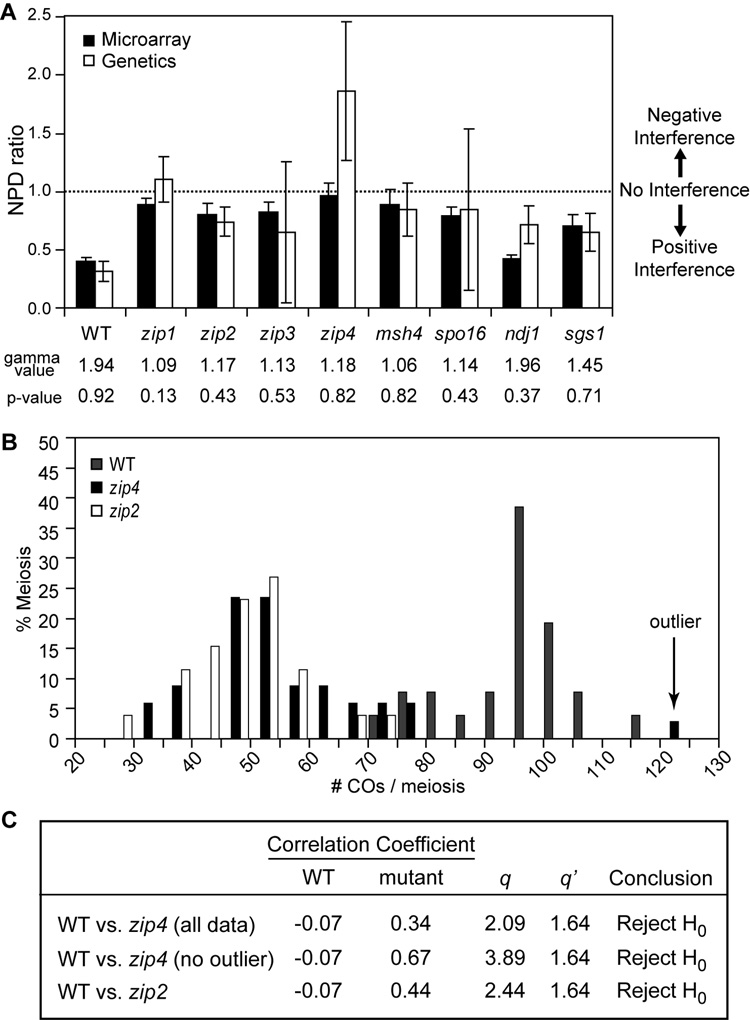
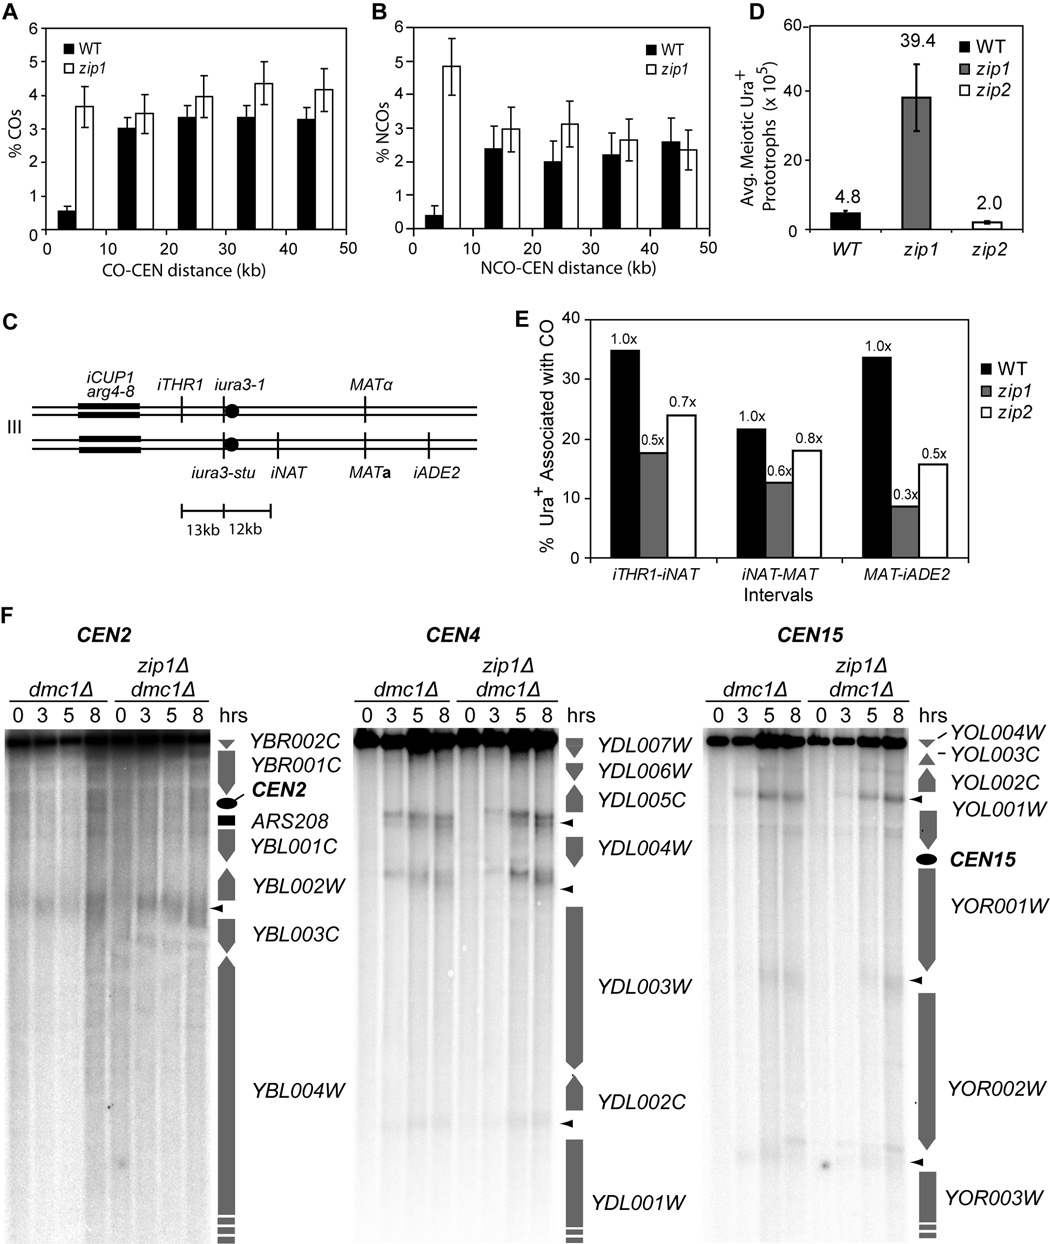
Tight control of the number and distribution of crossovers is of great importance for meiosis. Crossovers establish chiasmata, which are physical connections between homologous chromosomes that provide the tension necessary to align chromosomes on the meiotic spindle. Understanding the mechanisms underlying crossover control has been hampered by the difficulty in determining crossover distributions. Here, we present a microarray-based method to analyze multiple aspects of crossover control simultaneously and rapidly, at high resolution, genome-wide, and on a cell-by-cell basis. Using this approach, we show that loss of interference in zip2 and zip4/spo22 mutants is accompanied by a reduction in crossover homeostasis, thus connecting these two levels of crossover control. We also provide evidence to suggest that repression of crossing over at telomeres and centromeres arises from different mechanisms. Lastly, we uncover a surprising role for the synaptonemal complex component Zip1 in repressing crossing over at the centromere.


Figures

Figure 1
Figure 1. Characterization of Crossover Distribution in Wild Type
(A) Marker distribution for the S96/YJM789 strain shown for all 16 chromosomes. Vertical bars indicate the location of markers. (B) Plot of frequency of inter-marker distances. Over 78% of the markers are spaced less than 2 kb apart. Mean distance is 1.5 kb. (C) Mean number of COs per chromosome and total COs per meiosis were compared between microarray data and genetic map data obtained from the Saccharomyces Genome Database (SGD). Error bars denote 95% confidence interval (C.I.) of the microarray data. (D) Comparison of CO density between microarray and genetic data. 95% C.I.s are shown for microarray data.
Figure 2
Figure 2. CO and NCO Distributions near Telomeres and Centromeres in Wild Type
Distribution of COs and NCOs relative to the nearest telomere (A–D) or centromere (E–H). Microarray data from wild type is plotted against a simulated distribution that incorporates interference but assumes a uniform CO landscape along the chromosome. (B), (D), (F) and (H) show distributions without the 4 smallest chromosomes (1, 3, 6 and 9). Error bar = SD.
Figure 3
Figure 3. CO Distribution Pattern for Wild Type and zip4
Shown are CO distributions from representative tetrads from wild type (WT) (A) and zip4 (B). Black vertical bars indicate the location of COs, and blue bars indicate centromeres. S96 parental origin is displayed in green; YJM789 parental origin is shown in red. Yellow (S96) and magenta (YJM789) indicate less confidence (<99% probability) in the designation of marker origin. Yellow and magenta sections at the ends of chromosomes are extrapolations from the last known marker nearest the end.
Figure 4
Figure 4. Determination of Interference
Comparison of the experimental and best-fit gamma distribution for inter-CO distances for wild type with normal interference (A) and zip4 with reduced interference (B). γ = 1 indicates no interference, while γ > 1 indicates positive interference. (C) Hazard functions are calculated from the best-fit gamma distribution parameters for wild type (WT) (solid line) and zip4 (dotted line).
Figure 5
Figure 5. zip4 and zip2 Show Reduced CO Homeostasis
(A) Comparison of interference determined by microarray (simulated NPD ratio) and genetic approaches (NPD ratio). Genetic NPD ratios were obtained by averaging published NPD ratios; simulated NPD ratios were determined in this study (Table S4). Error bars = SD. Best fit gamma values are shown. P > 0.05 shows that the best fit inter-CO distribution fits well with the experimental distribution, as determined by chi-square analysis.(B) Dispersion of CO number per meiosis for WT (n = 26; in gray), zip4 (n = 34; in black) and zip2 (n = 26; in white). Black vertical arrow indicates the outlier zip4 tetrad with 126 COs. (C) Comparison of a control correlation coefficient (wild type) against mutants using an analog to the Dunnett’s test (Huitema, 1974). Correlation coefficients were calculated based on the numbers of COs and NCOs. q’ denotes critical value of q0.05,∞,3. q > q', rejects the hypothesis that correlations are the same.
Figure 6
Figure 6. Centromere-Proximal CO Repression Is Relieved in a zip1 Mutant
Comparison of centromere-proximal COs (A) and NCOs (B) in wild type and zip1. (C) Chromosome III markers in a strain used to genetically measure GCs and associated crossing over at the centromere (BR4633, Rockmill et al., 2006). (D) Frequency of Ura+ gene convertants from random spores for wild type, zip1 and zip2. SDs are shown. (E) Frequency of COs associated with Ura+ gene convertants for random spores for wild type, zip1 and zip2. Fold change relative to wild type is indicated above the bars. (F) dmc1Δ (NKY1455, (Bishop et al., 1992) and dmc1 Δ zip1 Δ (YAH2650, (Blitzblau et al., 2007b) cells were induced to undergo meiosis, and samples were collected at the indicated time points. Genomic DNA was digested and analyzed by Southern blot. The following restriction enzymes and probes (SGD coordinates) were used: CEN2, SacI, II:231,552–232,350; CEN4, SpeI, IV:448,180–449,164; CEN15, SphI/NheI, XV:331,713–332,402 (Blitzblau et al., 2007b). Black arrowheads indicate major DSB sites. CEN4 is located adjacent to YDL001W, off the bottom of the gel. Quantification of DSB frequencies is provided in Figure S5.

Comment in

References

    1. Agarwal S, Roeder GS. Zip3 provides a link between recombination enzymes and synaptonemal complex proteins. Cell. 2000;102:245–255. - PubMed
    1. Barton AB, Pekosz M, Kurvathi RS, Kaback DB. Meiotic Recombination at Chromosome Ends in Saccharomyces cerevisiae. Genetics. 2008 (Epub ahead of print) - PMC - PubMed
    1. Baudat F, de Massy B. Regulating double-stranded DNA break repair towards crossover or non-crossover during mammalian meiosis. Chromosome Res. 2007;15:565–577. - PubMed
    1. Bishop DK, Park D, Xu L, Kleckner N. DMC1: a meiosis-specific yeast homolog of E. coli recA required for recombination, synaptonemal complex formation, and cell cycle progression. Cell. 1992;69:439–456. - PubMed
    1. Blitzblau HG, Bell GW, Rodriguez J, Bell SP, Hochwagen A. Mapping of Meiotic Single-Stranded DNA Reveals Double-Strand-Break Hotspots near Centromeres and Telomeres. Curr Biol. 2007a - PubMed

Publication types

MeSH terms

Associated data