. 2008 Dec 15;64(12):1042-50.
doi: 10.1016/j.biopsych.2008.06.015. Epub 2008 Aug 9.

Common neural circuitry supporting volitional saccades and its disruption in schizophrenia patients and relatives

Affiliations

Common neural circuitry supporting volitional saccades and its disruption in schizophrenia patients and relatives

Jazmin Camchong et al. Biol Psychiatry. .

Abstract

Background: People with schizophrenia and their biological relatives have deficits in executive control processes such as inhibition and working memory as evidenced by performance abnormalities on antisaccade (AS) and ocular motor delayed response (ODR) tasks.

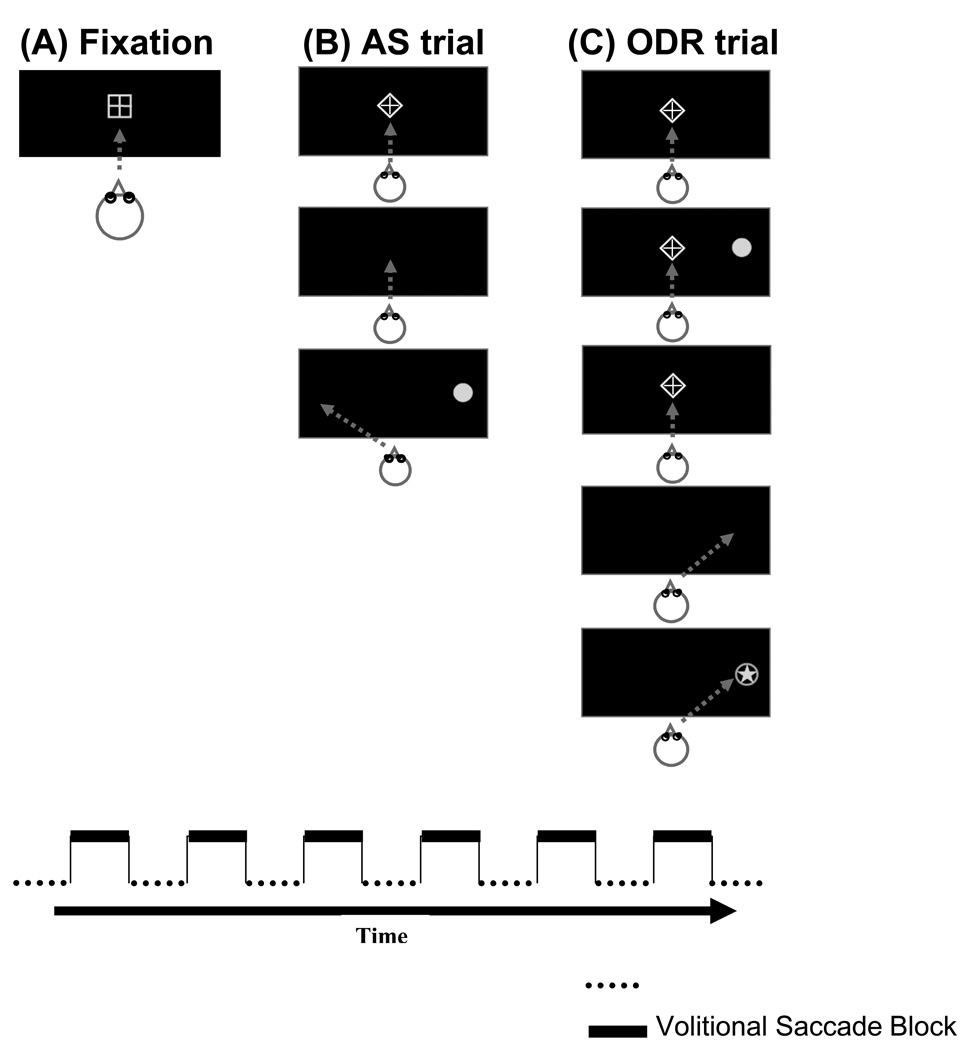
Methods: The present functional magnetic resonance imaging (fMRI) study was conducted to investigate brain activity associated with these putative indices of schizophrenia risk by: 1) directly comparing neural functioning in 15 schizophrenia patients, 13 of their first-degree biological relatives (primarily siblings), and 14 healthy participants; and 2) assessing executive function associated with volitional saccades by using a combination of AS and ODR tasks.

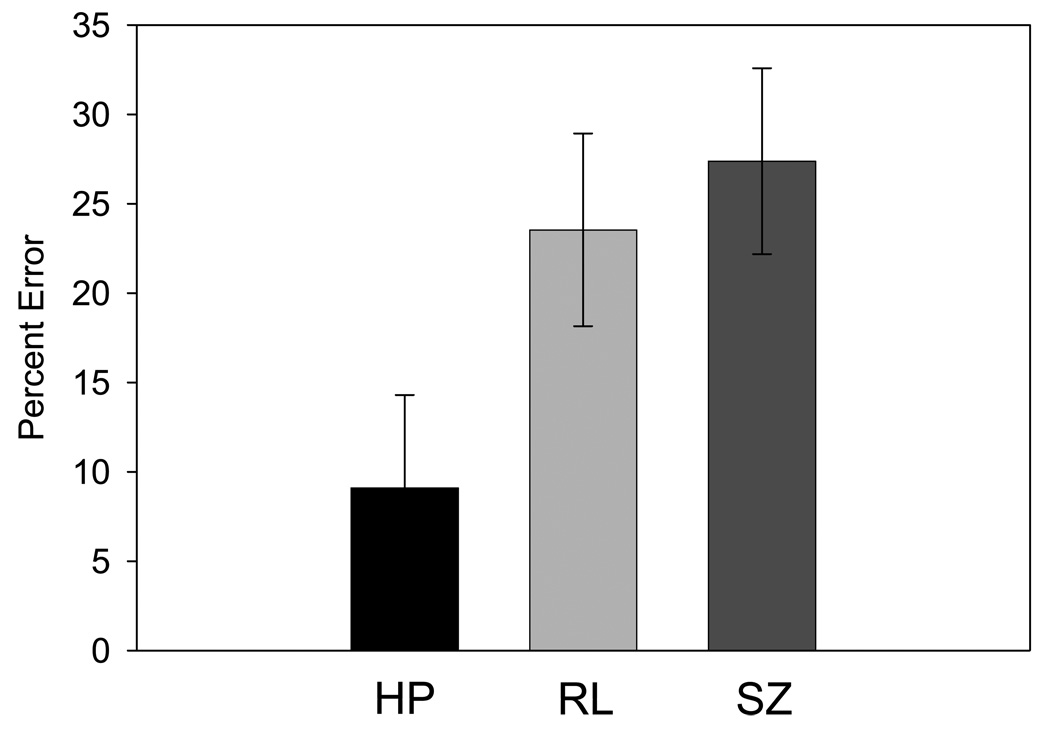
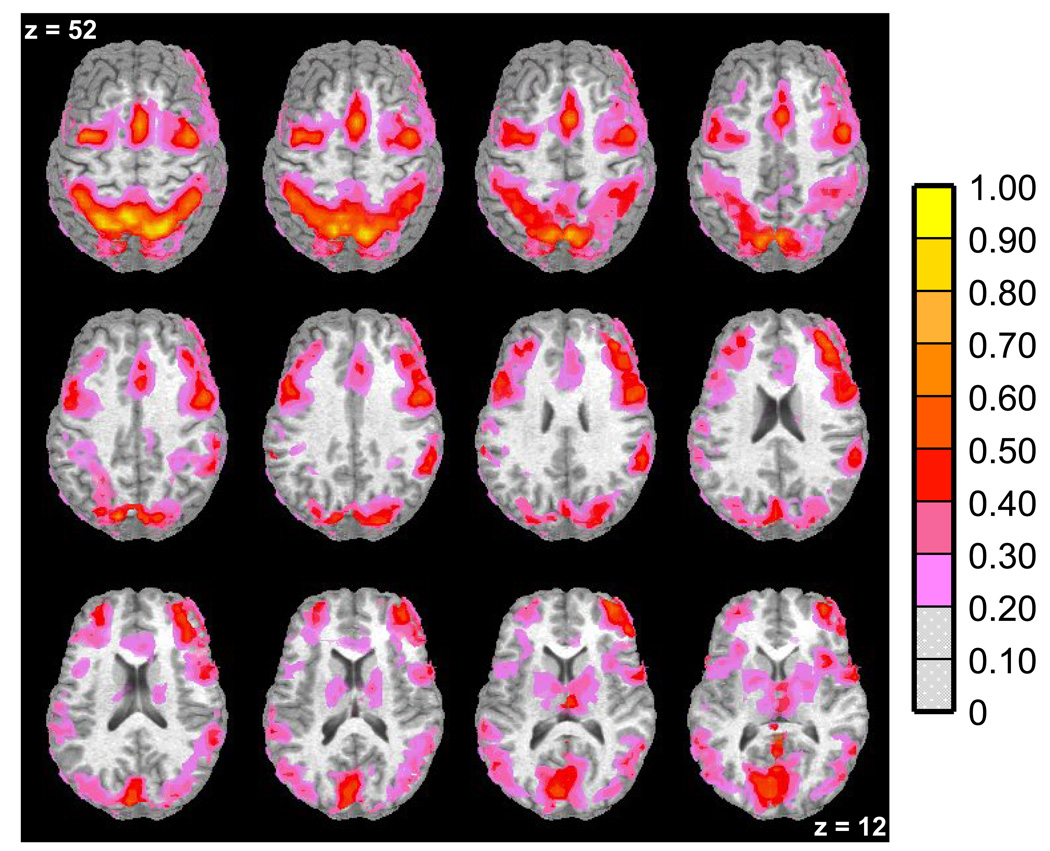
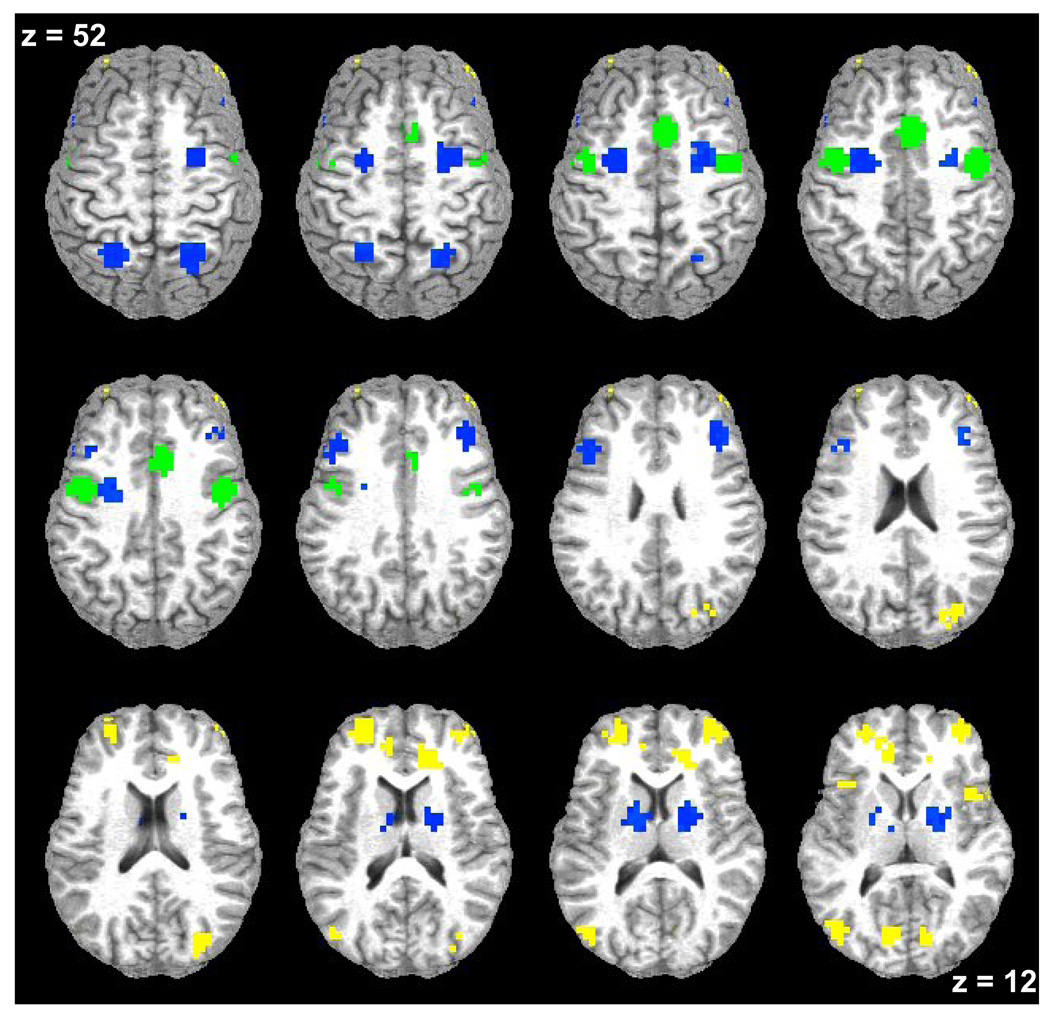
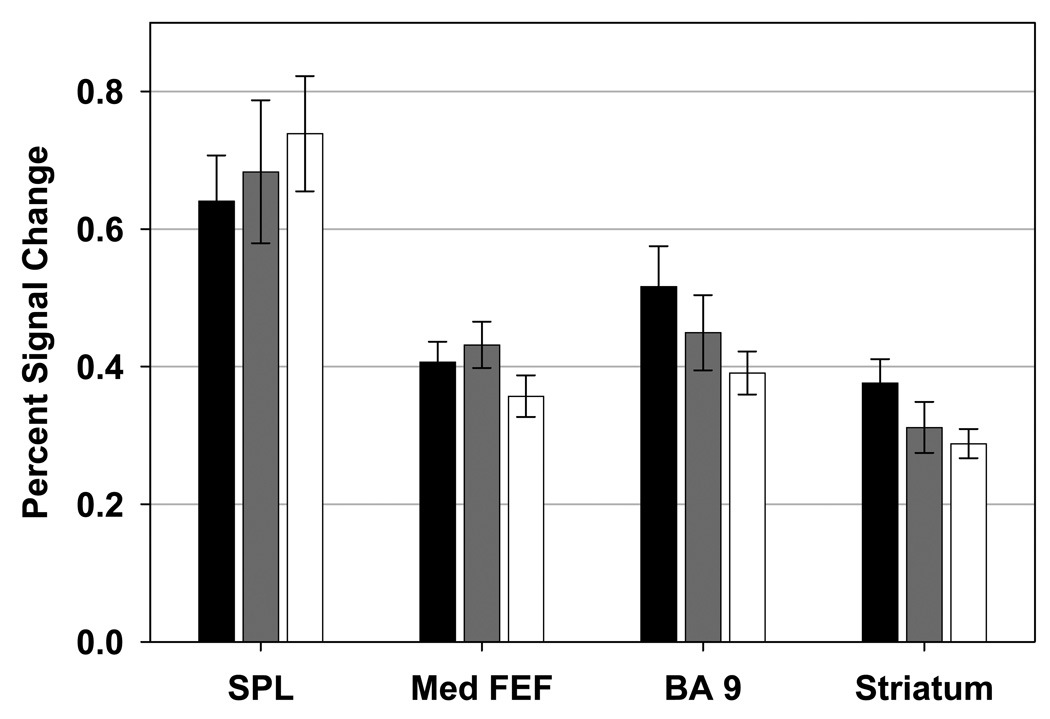
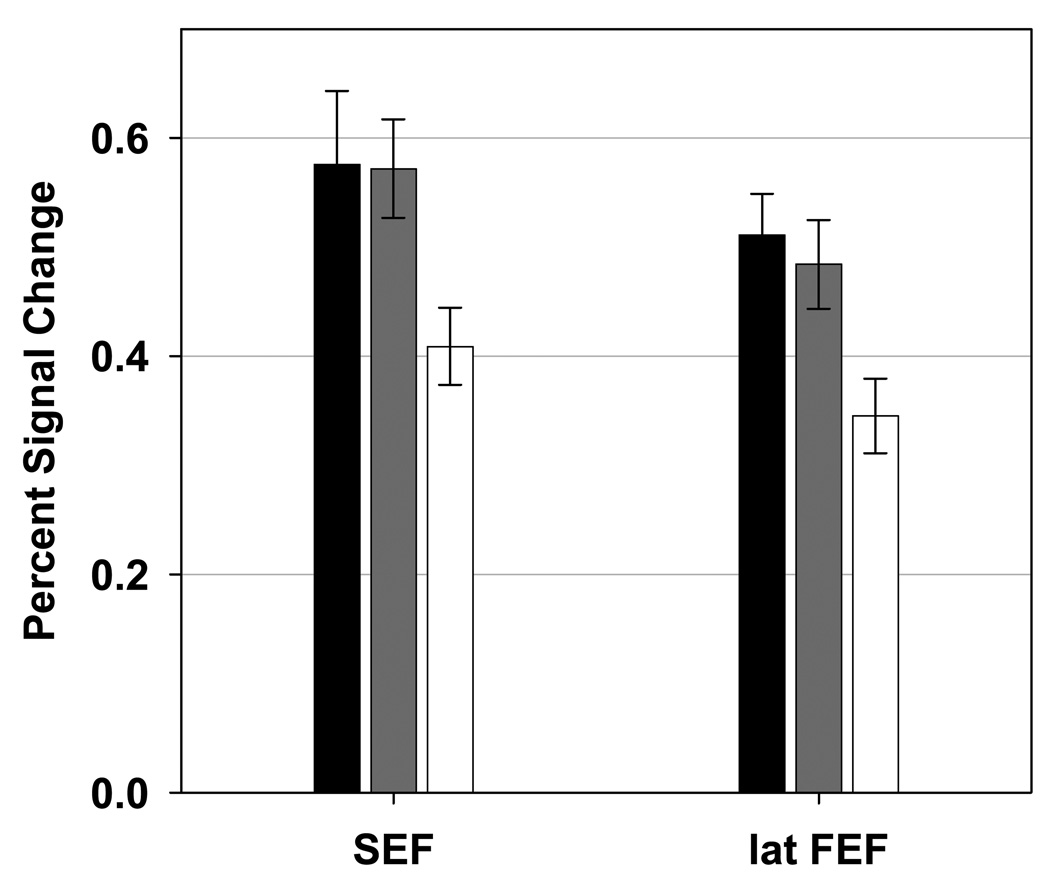
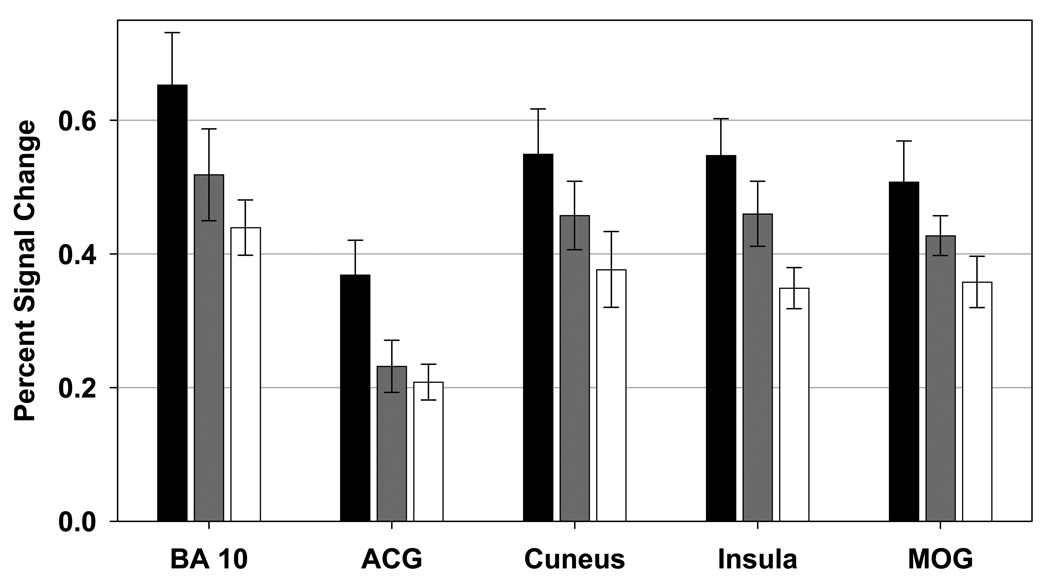
Results: Behavioral data showed that patients and relatives both made more volitional saccade errors. Imaging data demonstrated that within the context of preserved activity in some neural regions in patients and relatives, there were two distinct patterns of disruptions in other regions. First, there were deficits observed only in the schizophrenia group (decreased activity in lateral frontal eye field and supplementary eye field), suggesting a change associated with disease manifestation. Second, there were deficits observed in both patients and relatives (decreased activity in middle occipital gyrus, insula, cuneus, anterior cingulate, and Brodmann area 10 in prefrontal cortex), indicating a potential association with disease risk.

Conclusions: Results indicate that decreased brain activation in regions involved in managing and evaluating early sensory and attention processing might be associated with poor volitional saccade control and risk for developing schizophrenia.


Conflict of interest statement

Financial Disclosures

The authors report no biomedical financial interests or potential conflicts of interest.

Figures

Figure 1
Figure 1. Antisaccade (AS) and Ocular Motor Delayed Response (ODR) Task Trials
Stimuli presented during AS and ODR runs. During the AS run, participants were presented with 22.5-second blocks of fixation (1A) alternated with blocks of eight AS trials (1B). During the ODR run, participants were presented with 22.5-second blocks of fixation (1A) alternated with blocks of six ODR trials (1C). Gray arrows show correct eye position.
Figure 2
Figure 2. Behavioral Results – Percent Error
Bar graph showing mean percentage of errors (and standard error) generated during volitional saccade performance in the healthy participant group (HP), relative group (RL), and schizophrenia group (SZ).
Figure 3
Figure 3. Functional Magnetic Resonance Imaging (fMRI) Results – Whole-Brain Analysis Results for all Groups
Axial slices (top left z = 52 through bottom right z = 12, spacing = 8 mm) displaying regions with significant percent signal increase (indicated by the color scale) associated with volitional saccade performance in all groups. This one-sample t-map was used to determine regions of interest (ROIs). The background anatomical image is a structural image from one subject in neurological convention (left hemisphere on the left).
Figure 4
Figure 4. Functional Magnetic Resonance Imaging (fMRI) Results – Differences between Groups
Axial slices (top left z = 52 through bottom right z = 12, spacing = 8mm) displaying regions of interest with significant blood-oxygen-level-dependent signal increase associated with volitional task performance color coded by pattern of result. Regions in which all three groups showed task-related signal change are shown in blue. Regions in which the only the schizophrenia group is decreased are shown in green. Regions in which the schizophrenia and relative groups are decreased are shown in yellow. The background anatomical image is a structural image from one subject in neurological convention (left hemisphere on the left).
Figure 5
Figure 5. Regions of Interest with no Significant Differences between Groups
Bar graphs showing mean percent signal change (and standard error) for the healthy participant (black), relative (gray), and schizophrenia (white) groups. Regions of interest depicted showed no significant differences in task-related signal change between groups. SPL: superior parietal lobule, Med FEF: medial frontal eye fields, BA 9: brodmann area 9.
Figure 6
Figure 6. Regions of Interest in which the Schizophrenia Group Showed Decreased Activation
Bar graphs showing mean percent signal change (and standard error) for the healthy participant (black), relative (gray), and schizophrenia (white) groups. Regions of interest depicted showed significantly lower task-related signal change was observed in the schizophrenia group than in the normal and relative groups. SEF: supplementary eye fields, lat FEF: lateral frontal eye fields.
Figure 7
Figure 7. Regions of Interest in which both the Schizophrenia and Relative Groups Showed Decreased Activation
Bar graphs showing mean percent signal change (and standard error) for the healthy participant (black), relative (gray), and schizophrenia (white) groups. Regions of interest depicted showed lower task-related signal change in the schizophrenia group than in the healthy participant group. Task-related signal change in the relative group did not differ from either the schizophrenia or normal groups. BA 10: brodmann area 10, ACG: anterior cingulate gyrus, MOG: middle occipital gyrus.

References

    1. Callicott JH, Bertolino A, Mattay VS, Langheim FJ, Duyn J, Coppola R, et al. Physiological dysfunction of the dorsolateral prefrontal cortex in schizophrenia revisited. Cereb Cortex. 2000;10:1078–1092. - PubMed
    1. Chan RC, Chen EY, Law CW. Specific executive dysfunction in patients with first episode medication-naive schizophrenia. Schizophr Res. 2006;82:51–64. - PubMed
    1. Glahn DC, Ragland JD, Abramoff A, Barrett J, Laird AR, Bearden CE, Velligan DI. Beyond hypofrontality: a quantitative meta-analysis of functional neuroimaging studies of working memory in schizophrenia. Hum Brain Mapp. 2005;25:60–69. - PMC - PubMed
    1. Jansma JM, Ramsey NF, van der Wee NJ, Kahn RS. Working memory capacity in schizophrenia: a parametric fMRI study. Schizophr Res. 2004;68:159–171. - PubMed
    1. Kuha A, Tuulio-Henriksson A, Eerola M, Perala J, Suvisaari J, Partonen T, Lonnqvist J. Impaired executive performance in healthy siblings of schizophrenia patients in a population-based study. Schizophr Res. 2007;92:142–150. - PubMed

Publication types