. 2008 Nov;29(31):4244-52.
doi: 10.1016/j.biomaterials.2008.07.020. Epub 2008 Aug 8.

Quantification of the force of nanoparticle-cell membrane interactions and its influence on intracellular trafficking of nanoparticles

Affiliations

Quantification of the force of nanoparticle-cell membrane interactions and its influence on intracellular trafficking of nanoparticles

Jaspreet K Vasir et al. Biomaterials. 2008 Nov.

Abstract

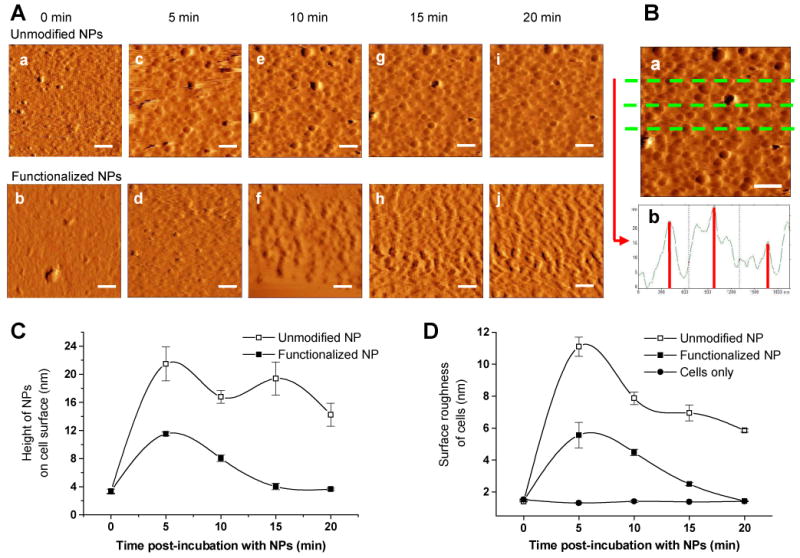
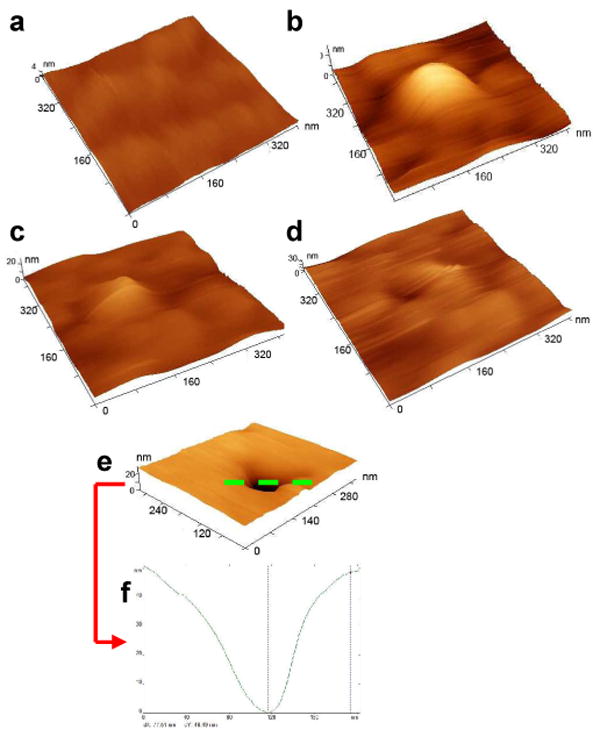
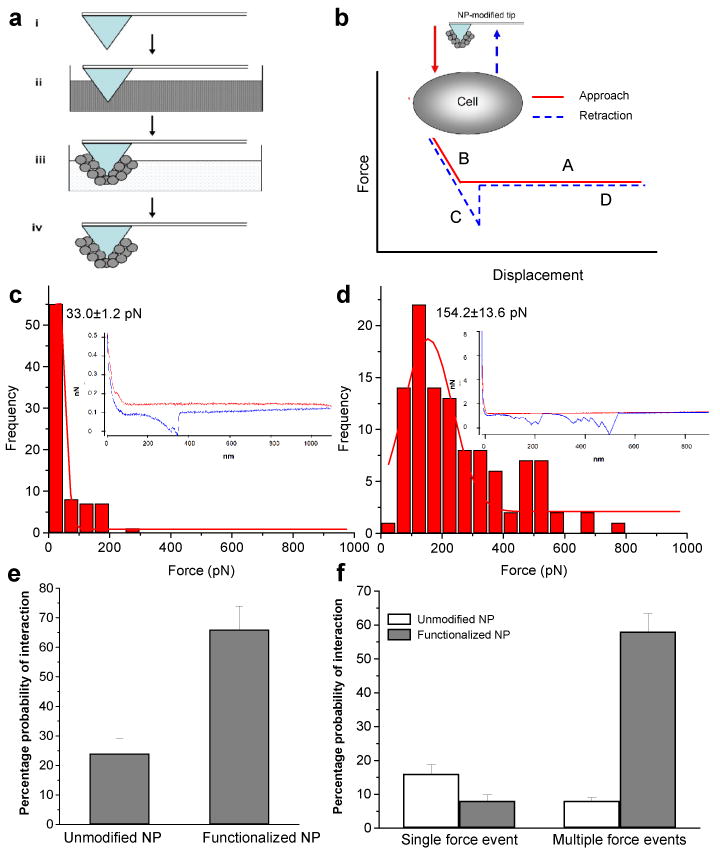
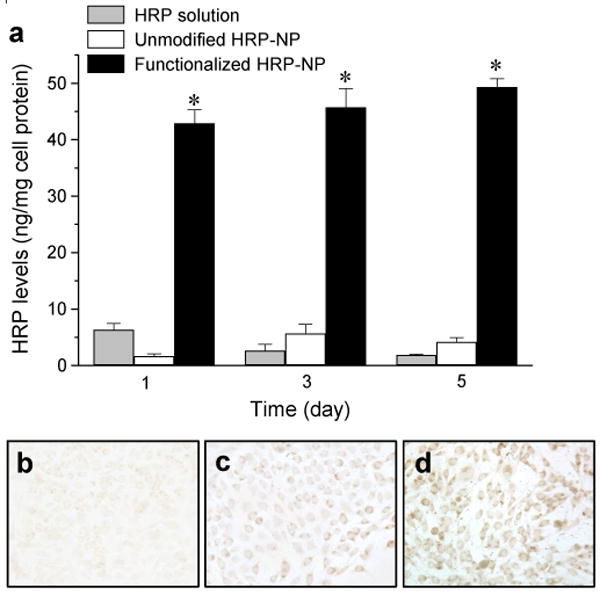
Understanding the interaction of nanoparticles (NPs) with the cell membrane and their trafficking through cells is imperative to fully explore the use of NPs for efficient intracellular delivery of therapeutics. Here, we report a novel method of measuring the force of NP-cell membrane interactions using atomic force microscopy (AFM). Poly(D,L-lactide-co-glycolide) (PLGA) NPs functionalized with poly-L-lysine were used as a model system to demonstrate that this force determines the adhesive interaction of NPs with the cell membrane and in turn the extent of cellular uptake of NPs, and hence that of the encapsulated therapeutic. Cellular uptake of NPs was monitored using AFM imaging and the dynamics of their intracellular distribution was quantified using confocal microscopy. Results demonstrated that the functionalized NPs have a five-fold greater force of adhesion with the cell membrane and the time-lapse AFM images show their rapid internalization than unmodified NPs. The intracellular trafficking study showed that the functionalized NPs escape more rapidly and efficiently from late endosomes than unmodified NPs and result in 10-fold higher intracellular delivery of the encapsulated model protein. The findings described herein enhance our basic understanding of the NP-cell membrane interaction on the basis of physical phenomena that could have wider applications in developing efficient nanocarrier systems for intracellular delivery of therapeutics.


Figures

Figure 1
Figure 1
(A) Time lapse AFM imaging. Images of cell surface incubated with unmodified NPs (a, c, e, g, i) and functionalized NPs (b, d, f, h, j). AFM images (amplitude traces) of the cell surface immediately prior to addition of NPs (a, b), and after incubation with NPs for 5 min (c, d), 10 min (e, f), 15 min (g, h) and 20 min (i, j). All images are 2 × 2 μm, acquired in tapping mode in liquid. Scale bar represents 300 nm. (B) Image analysis. (a) AFM image of cell surface 15 min after incubation with unmodified NPs. Image is 2 × 2 μm, acquired in tapping mode in liquid. Scale bar represents 300 nm. (b) Section analysis along the green lines in a. Cell surface topology: effect of incubation with NPs. (C) Average height of NPs on the cell surface was calculated from the section analysis at different times of incubation with NPs. Data is presented as mean ± standard deviation. (D) Average roughness of the cell surface as determined using Femtoscan software was plotted for incubation of cell surface with unmodified and functionalized NPs. Data are presented as mean ± standard deviation.
Figure 2
Figure 2. Dynamic changes on cell surface after incubation with NPs
Three-dimensional images of cell surface before (a) and after incubation with NPs for 10 min (b), 15 min (c) and 20 min (d). All AFM images shown are cropped 400 × 400 nm images from the 2 × 2 μm images acquired in tapping mode in liquid. (e, f) Formation of endocytic pit on cell surface. (e) Three-dimensional image of cell surface showing a typical pit formed on the surface after incubation with NPs. (f) Section analysis along the green line in e. The AFM image shown is a cropped 300 × 300 nm image from the 2 × 2 μm image acquired in liquid. The three-dimensional views were generated using Femtoscan software.
Figure 3
Figure 3. Measurement of force of interaction between NPs and live cells
(a) Schematic representation of the process of coating AFM tip with NPs. (i) Uncoated AFM tip, (ii) AFM tip placed in the NP formulation; chloroform was evaporated under vacuum, (iii) AFM tip was washed with water and dried in argon gas, and (iv) AFM tip coated with NPs (b) Diagram of a typical force curve (red solid line: approach curve; blue dashed line: retraction curve). The x-axis represents displacement and the y-axis represents force calculated as the product of spring constant of the cantilever and the cantilever deflection. Inset, schematic representation of the setup for collection of force curves on the cell surface with AFM tip coated with NPs. Typical/representative force curve for AFM tip coated with unmodified NPs (c, inset) and functionalized NPs (d, inset). Analysis of force distributions for unmodified NPs (c) and functionalized NPs (d). Probability of interaction of NP-coated tip and cell surface was calculated as the percentage of force curves that showed interactive forces of the total forces collected with the tip (e). Probability of occurrence of single and multiple force events was calculated for the unmodified and functionalized NPs (f). Data are presented as mean ± standard deviation.
Figure 4
Figure 4. Cellular uptake of nanoparticles
(a) Uptake of functionalized and unmodified NPs. A formulation of NPs containing a fluorescent dye (6-coumarin) that acts as a probe for NPs was used to quantitatively determine the cellular uptake of NPs using HPLC. Amount of NPs analyzed by HPLC was normalized to the total cell protein. Data are presented as mean ± standard deviation, n = 6. (*) p < 0.05. (b) Schematic representation of the process of intracellular trafficking of NPs following endocytosis (EE, early endosome; Lys, lysosome; RE, recycling endosome). Representative confocal microscopic images of cells incubated with green, fluorescently labeled NPs and Texas red transferrin. (c) Green fluorescence arising from the cellular internalization of NPs. (d) Red fluorescence arising from the presence of Texas red transferrin in EE. (e) Co-localization of NPs in endosomes is shown in yellow (from the overlap of green and red images). (f) Schematic illustrating the method used to quantify subcellular distribution of NPs. The pixel areas for cellular (fluorescein filter) and endosomal (co-localized with endosomes) content of NPs were determined in each x-y plane and were denoted as Az (cellular) and Az (endosomal). The fraction of NPs escaping into the cytosol was indicated by the pixel area Az (cytosol) and was calculated as Az (cytosol) = [Az (cellular)] – [Az (endosomal)]. The values of Az (cytosol) and Az (endosomal) were summed for all the z-sections and denoted as A (cytosol) and A (endosomal), respectively. Subcellular distribution of NPs: confocal microscopy. (g) NP levels in EE. (h) NP levels in LE. (i) Localization of NPs in the cytoplasm of cells. Data are presented as mean ± standard deviation, n=15. Open circles represent unmodified NPs and solid circles represent functionalized NPs.
Figure 5
Figure 5. Sustained cytoplasmic delivery of model protein HRP
Cells were incubated with a 4-μg dose of HRP either in solution or encapsulated in NP formulations for 24 hr. Medium was changed after 24 hr and then every alternate day. (a) After 1, 3 and 5 days, cells were washed and lysed, and their HRP levels were determined by activity assay (OPD colorimetric assay) of HRP. Amount of active HRP was normalized to the total cell protein. Data are presented as mean ± standard deviation, n = 6, (*) p < 0.05. After 5 days, cells were washed with PBS, fixed and incubated with DAB/Ni2+ substrate to stain active HRP enzyme in (b) cells treated with HRP solution, (c) HRP-loaded unmodified NPs, and (d) HRP-loaded functionalized NPs.

References

    1. Panyam J, Labhasetwar V. Targeting intracellular targets. Curr Drug Deliv. 2004;1(3):235–47. - PubMed
    1. Kwon GS. Polymeric micelles for delivery of poorly water-soluble compounds. Crit Rev Ther Drug Carrier Syst. 2003;20(5):357–403. - PubMed
    1. Duncan R. Designing polymer conjugates as lysosomotropic nanomedicines. Biochem Soc Trans. 2007;35(Pt 1):56–60. - PubMed
    1. Vinogradov SV, Bronich TK, Kabanov AV. Nanosized cationic hydrogels for drug delivery: preparation, properties and interactions with cells. Adv Drug Deliv Rev. 2002;54(1):135–47. - PubMed
    1. Vasir JK, Labhasetwar V. Biodegradable nanoparticles for cytosolic delivery of therapeutics. Adv Drug Deliv Rev. 2007;59(8):718–28. - PMC - PubMed

Publication types

Substances