. 2008 Dec;34(12):2009-18.
doi: 10.1016/j.ultrasmedbio.2008.05.003. Epub 2008 Aug 9.

Examination of inertial cavitation of Optison in producing sonoporation of chinese hamster ovary cells

Affiliations

Examination of inertial cavitation of Optison in producing sonoporation of chinese hamster ovary cells

Monica M Forbes et al. Ultrasound Med Biol. 2008 Dec.

Abstract

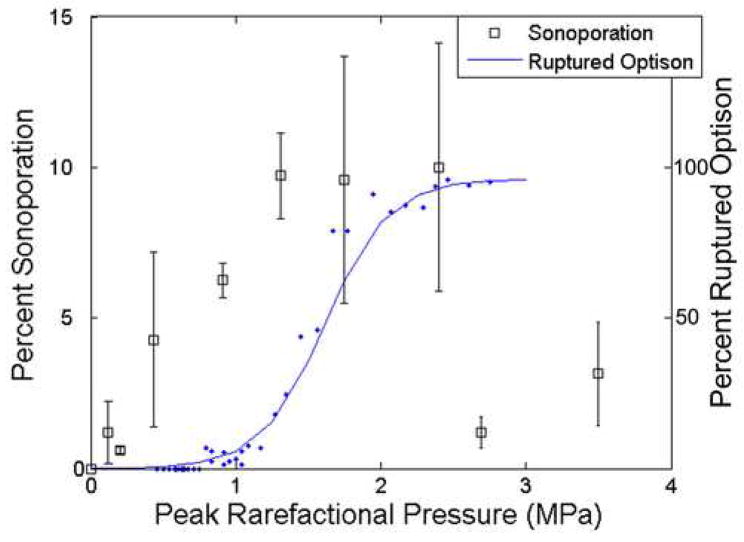
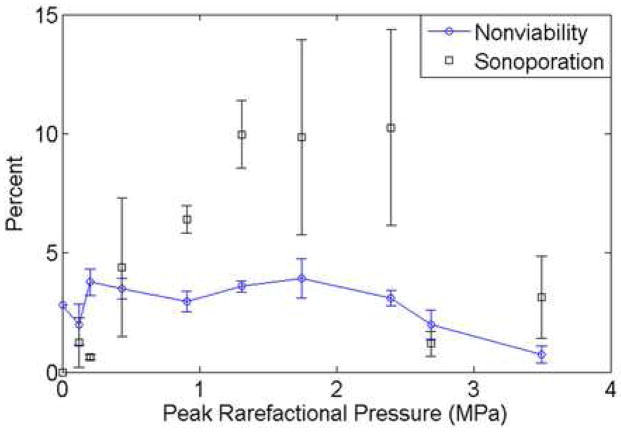
The objective of this project was to elucidate the relationship between ultrasound contrast agents (UCAs) and sonoporation. Sonoporation is an ultrasound-induced, transient cell membrane permeability change that allows for the uptake of normally impermeable macromolecules. Specifically, this study will determine the role that inertial cavitation plays in eliciting sonoporation. The inertial cavitation thresholds of the UCA, Optison, are compared directly with the results of sonoporation to determine the involvement of inertial cavitation in sonoporation. Chinese hamster ovary (CHO) cells were exposed as a monolayer in a solution of Optison, 500,000 Da fluorescein isothiocyanate-dextran (FITC-dextran), and phosphate-buffered saline (PBS) to 30 s of pulsed ultrasound at 3.15-MHz center frequency, 5-cycle pulse duration and 10-Hz pulse repetition frequency. The peak rarefactional pressure (P(r)) was varied over a range from 120 kPa-3.5 MPa, and five independent replicates were performed at each pressure. As the P(r) was increased, from 120 kPa-3.5 MPa, the fraction of sonoporated cells among the total viable population increased from 0.63-10.21%, with the maximum occurring at 2.4 MPa. The inertial cavitation threshold for Optison at these exposure conditions has previously been shown to be in the range 0.77-0.83 MPa, at which sonoporation activity was found to be 50% of its maximum level. Furthermore, significant sonoporation activity was observed at pressure levels below the threshold for inertial cavitation of Optison. Above 2.4 MPa, a significant drop in sonoporation activity occurred, corresponding to pressures where >95% of the Optison was collapsing. These results demonstrate that sonoporation is not directly a result of inertial cavitation of the UCA, rather that the effect is related to linear and/or nonlinear oscillation of the UCA occurring at pressure levels below the inertial cavitation threshold.


Figures

Fig 1
Fig 1
The numerous UCA responses to US and the possible bioeffects of each response, thus emphasizing the critical junction of IC versus oscillation in determining the mechanism for sonoporation.
Fig 2
Fig 2
The loading pattern of the 96-well microwell plate. Note that the top and bottom rows are left empty and every other well is loaded.
Fig 3
Fig 3
The experimental setup.
Fig 4
Fig 4
A) Example of the side-scatter (SS) versus forward scatter (FS) histogram obtained by the flow cytometer. The cells within the ellipsoid region are the whole cells, viable and nonviable, that are used in the sonoporation analysis. All points not located within the ellipse are designated as cell debris. B) Example of the FITC histogram obtained by the flow cytometer. The control histogram is from the sham exposed sample (US turned off) and the exposed histogram is from the sample exposed to US. The subtraction histogram is the result when subtracting the control histogram from the exposed histogram. The number of cells in the subtraction histogram divided by the number of cells in the exposed histogram is the percentage of sonoporated cells. C) Example of the PI histogram. The region R1 represents the cells stained with PI and designated as nonviable.
Fig 4
Fig 4
A) Example of the side-scatter (SS) versus forward scatter (FS) histogram obtained by the flow cytometer. The cells within the ellipsoid region are the whole cells, viable and nonviable, that are used in the sonoporation analysis. All points not located within the ellipse are designated as cell debris. B) Example of the FITC histogram obtained by the flow cytometer. The control histogram is from the sham exposed sample (US turned off) and the exposed histogram is from the sample exposed to US. The subtraction histogram is the result when subtracting the control histogram from the exposed histogram. The number of cells in the subtraction histogram divided by the number of cells in the exposed histogram is the percentage of sonoporated cells. C) Example of the PI histogram. The region R1 represents the cells stained with PI and designated as nonviable.
Fig 5
Fig 5
Sonoporation of CHO cells exposed at 3.15 MHz, 5 cycles, 10 Hz and for 30 s compared to the occurrence of ruptured Optison. The collapse threshold for Optison occurs at 0.83 MPa.
Fig 6
Fig 6
Percentage of nonviable cells exposed at 3.15 MHz, 5 cycles, 10 Hz and for 30 s in the presence of Optison compared to the sonoporation activity for the same exposure conditions.
Fig 7
Fig 7
Percentage of items counted by flow cytometer that were designated as cell debris from samples exposed at 3.15 MHz, 5 cycles, 10 Hz and for 30 s in the presence of Optison.
Fig 8
Fig 8
Percentage of sonoporated cells exposed at 3.15 MHz, 5 cycles, 10 Hz and for 30 s without Optison compared to the percentage of sonoporated cells with Optison for Pr of 0.204, 1.74, and 2.69 MPa.

References

    1. Agresti A. An Introduction for Categorical Analysis. New York: Wiley; 1996.
    1. Amabile PG, Lewis JM, Lewis TN. High-efficiency endovascular gene delivery via therapeutic ultrasound. Journal of the American College of Cardiology. 2001;37:1975–80. - PubMed
    1. Ammi AY. Doctoral Thesis. University of Paris VI: 2006. Detection et caracterisation de la destruction des microbulles de produit de contrast e ultrasonore (Detection and characterization of the destruction of ultrasound contrast agents) In English.
    1. Ammi AY, Bridal SL, Mamou J, Wang GI, O’Brien WD., Jr Automatic Detection of Ultrasound Contrast Microbubble Shell Rupture. Proceedings of the 2006 IEEE Ultrasonics Symposium; 2006a. pp. 297–300.
    1. Ammi AY, Cleveland RO, Mamou J, Wang GI, Bridal SL, O’Brien WD., Jr Ultrasonic contrast agent shell rupture detected by inertial cavitation and rebound signals. IEEE transactions on Ultrasonics, Ferroelectrics, and Frequency control. 2006b;53:126–36. - PMC - PubMed

Publication types