. 2008 Aug 14;4(2):123-33.
doi: 10.1016/j.chom.2008.05.016.

Transcriptional interference antagonizes proviral gene expression to promote HIV latency

Affiliations

Transcriptional interference antagonizes proviral gene expression to promote HIV latency

Tina Lenasi et al. Cell Host Microbe. .

Abstract

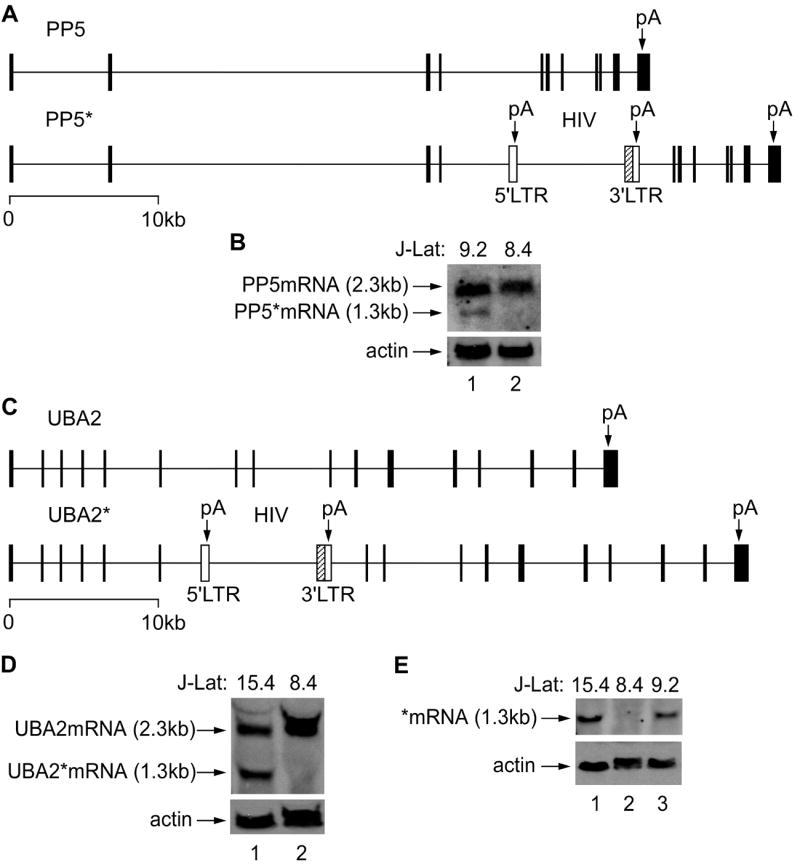
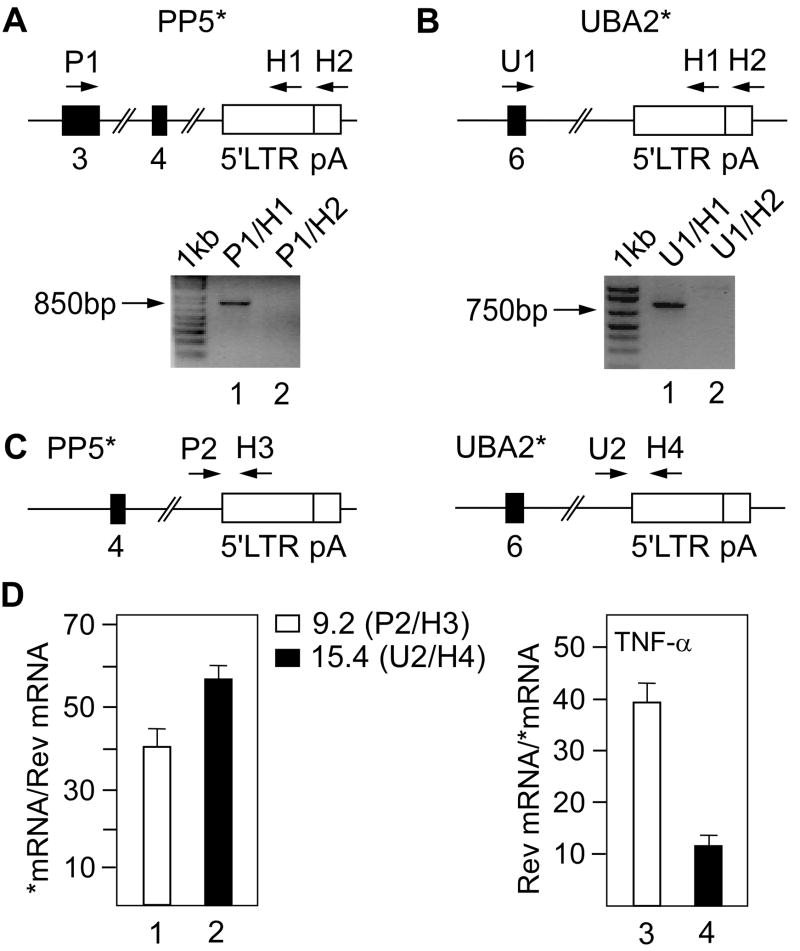
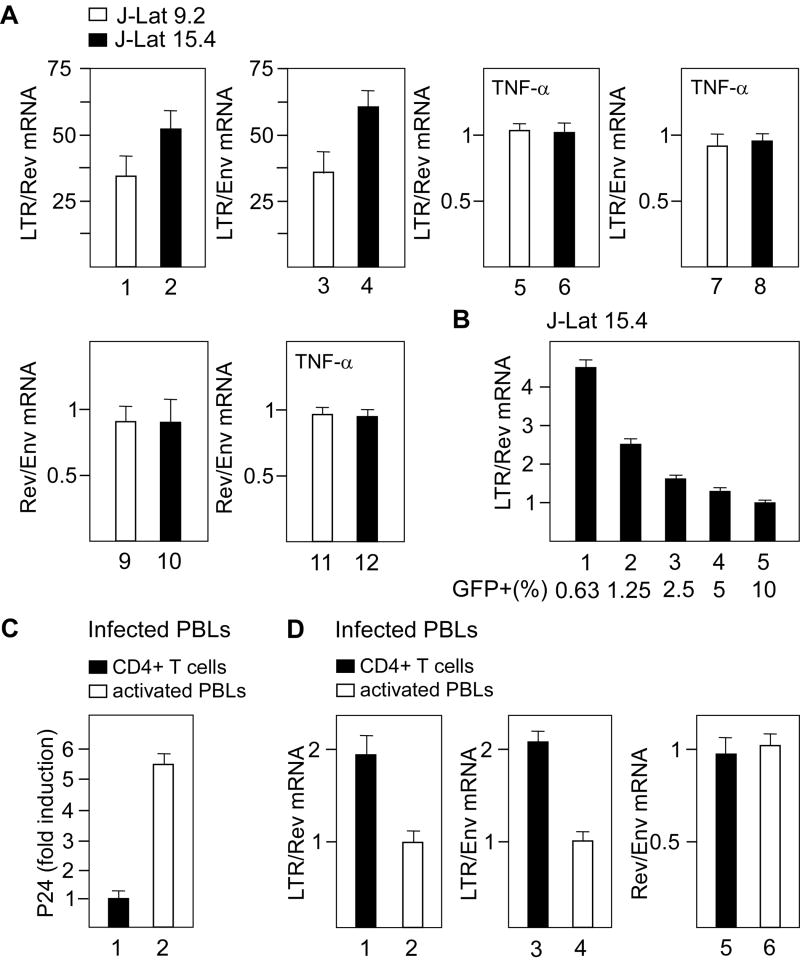
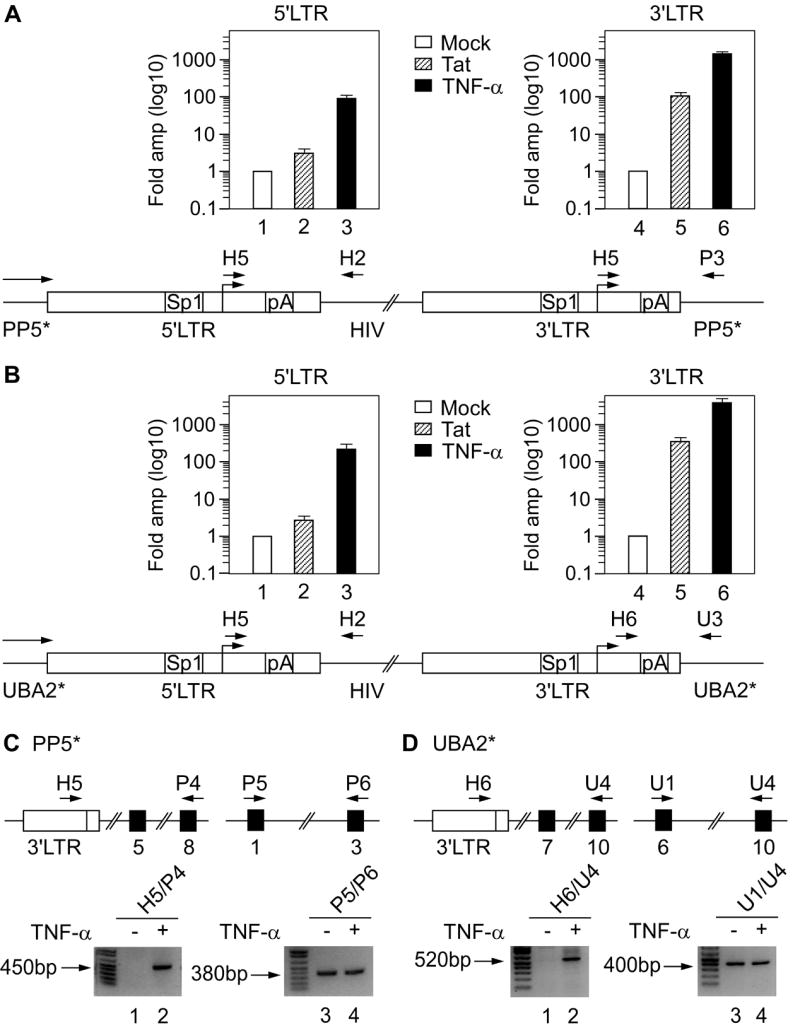
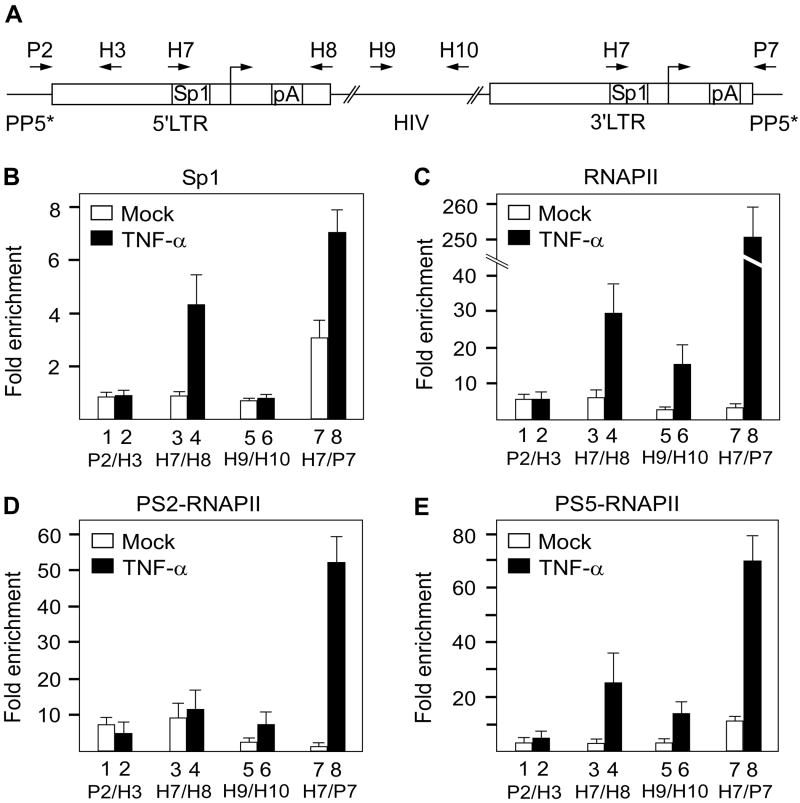
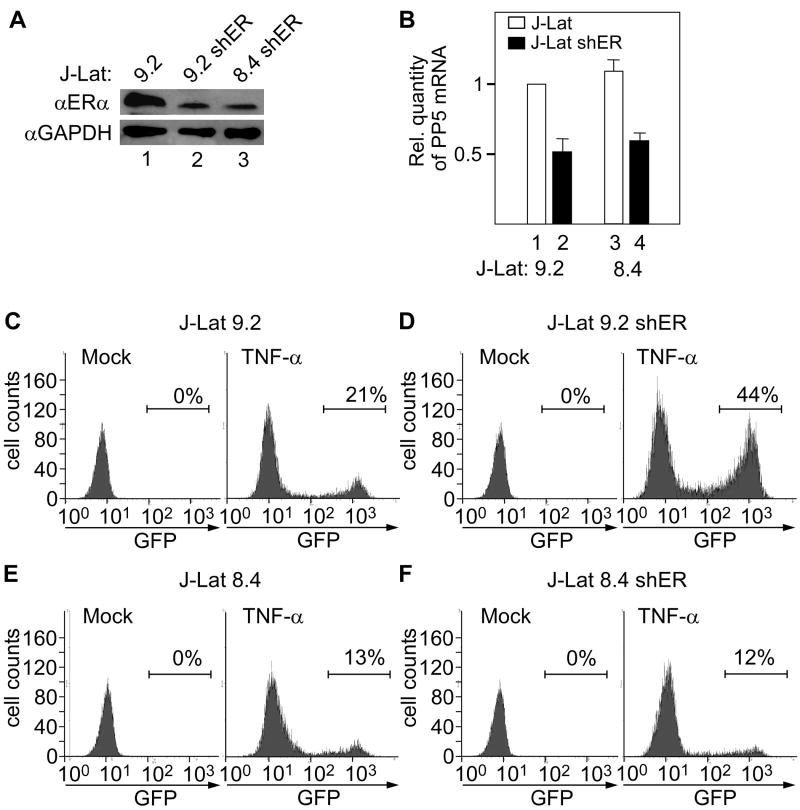
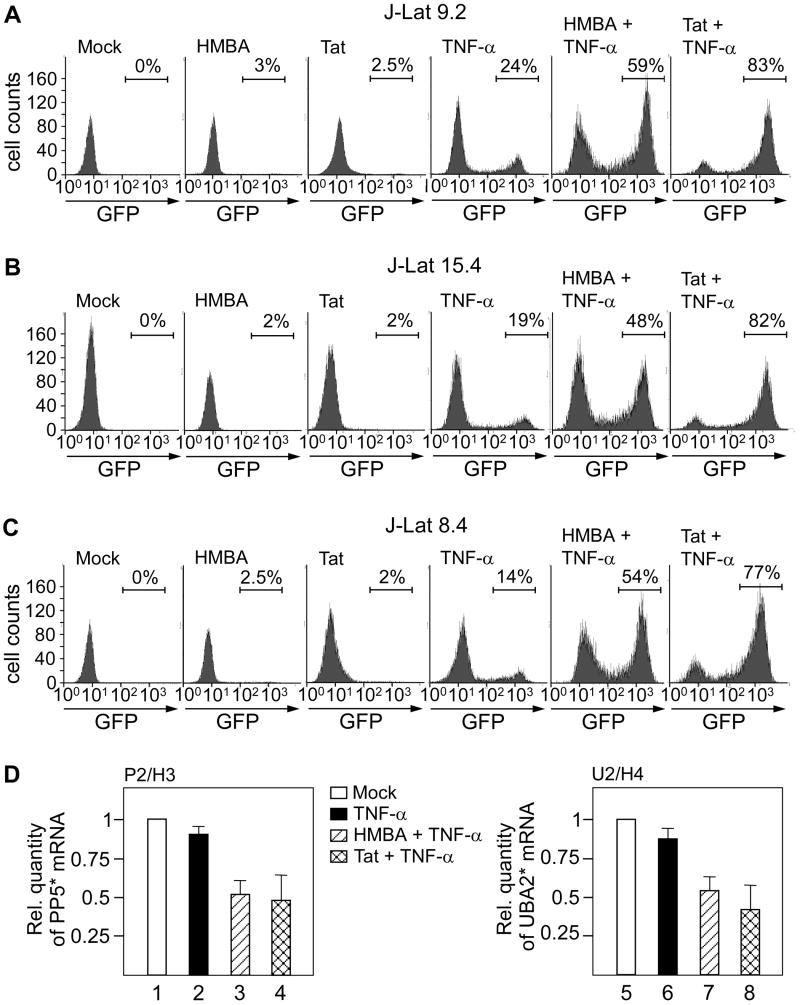
Eradication of the latent HIV reservoir remains a major barrier to curing AIDS. However, the mechanisms that direct viral persistence in the host are not well understood. Studying a model system of postintegration latency, we found that viral integration into the actively transcribed host genes led to transcriptional interference (TI) caused by the elongating RNA polymerase II (RNAPII) transcribing through the viral promoter. The resulting physical exclusion of preinitiation complex formation on the 5' long terminal repeat (LTR) promoted the silencing of HIV transcription. This block could be counteracted by inhibiting the upstream transcription or cooperatively activating viral transcription initiation and elongation. Importantly, PCR-based analysis, which detects host transcription through the 5'LTR independently of the viral integration site, revealed substantial levels of this transcription in HIV-infected primary CD4(+) T cells. Collectively, our findings suggest that TI contributes significantly to HIV latency and should be considered when attempting to purge the latent reservoir.


Figures

Figure 1
Figure 1. Transcription of a gene with the integrated viral genome in J-Lat 9.2 and 15.4 cells yields two different forms of mRNA
(A and C) Schematic representations of the PP5 and UBA2 genes on the two homologous chromosomes in J-Lat 9.2 or 15.4 cells. The provirus is integrated into the intron 4 of the PP5 gene (PP5* allele) or the intron 6 of the UBA2 gene (UBA2* allele) as indicated. Black rectangles depict exons and white rectangles depict the 5’ and 3’LTRs. In the HIV genome, the nef gene was replaced by the GFP gene as indicated by the hatched rectangle. Vertical arrows mark pA sites in the PP5 or UBA2 gene and the two viral LTRs. (B and D) Northern blotting was used to detect PP5 transcripts from exon 1 to 3 and UBA2 transcripts from exon 2 to 6. PP5mRNA and UBA2mRNA represent the full length mRNA, whereas PP5*mRNA and UBA2*mRNA correspond to the truncated mRNA transcribed from the PP5* and UBA2* alleles, respectively. (E) Northern blotting was used to detect transcripts containing the LTR (-281 to +3) in J-Lat 9.2 and 15.4 cells. Actin levels were used for loading controls in Northern blotting and J-Lat 8.4 cells were used as the control.
Figure 2
Figure 2. The host-viral chimeric transcripts in J-Lat 9.2 and 15.4 cells terminate in the 5’LTR
(A and B) RT-PCR was used to determine the termination of PP5 *mRNA and UBA *mRNA. Schematic representations of a part of the PP5* and UBA2* alleles with numbered exons (black rectangles) and 5’LTR (white rectangle) are presented on top. The vertical line in the 5’LTR represents the pA site. Primers used for amplification of cDNA are marked above the schemes. Bottom panels show agarose gels with fragments obtained by RT-PCR of the same sample. The primer pairs used are denoted above the lanes. (C) Schematic representations of a part of the PP5* and UBA2* alleles with numbered exons (black rectangles) and 5’LTR (white rectangle). Primers used for amplification of cDNA corresponding to the truncated transcripts are marked above the scheme. (D) Ratio between *mRNA and HIV (Rev) mRNA in untreated (left panel) or between HIV (Rev) mRNA and *mRNA in TNF-α-treated (right panel) J-Lat 9.2 (white bars) and 15.4 (black bars) cells determined by RT-DqPCR. Primers amplifying cDNA for truncated transcripts are denoted for each of the two cell lines, Rev cDNA was amplified with primer pair H13/H14 (Table S1). Values of amplified cDNA were normalized to DNA amplified with the same primer pair. The results for three RT-DqPCR assays are shown ± SEM.
Figure 3
Figure 3. Identification of upstream transcription in J-Lat cells and HIV-infected primary CD4+ T cells
(A) Ratios between mRNAs containing LTR and Rev or Env in untreated (the two upper left panels) or TNF-α-treated (the two upper right panels) J-Lat 9.2 (white bars) and 15.4 (black bars) cells as determined by RT-DqPCR. Lower panels represent ratios between mRNAs containing Rev and Env in untreated (left) or TNF-α-treated (right) cells. (B) Ratios between mRNAs containing LTR and Rev in J-Lat 15.4 cells with different levels of viral expression (designated as percentage of GFP+) as determined by RT-DqPCR. (C) Viral production as assessed by p24 ELISA of HIV-infected CD4+ T cells (black bar) and activated PBLs (white bar). The results for two assays are shown ± SEM. (D) Ratios between mRNAs containing LTR and Rev (left panel), LTR and Env (middle panel) and Rev and Env (right panel) in CD4+ T cells (black bars) and activated PBLs (white bars) as determined by RT-DqPCR. In the RT-DqPCR assays, the values of amplified cDNA were normalized to DNA amplified with the same primer pair (H11/H12 in LTR, H13/H14 in Rev, H15/H16 in Env (Table S1)). The results for three RT-DqPCR assays are shown ± SEM.
Figure 4
Figure 4. Upstream transcription interferes with the activation of 5’ but not 3’LTR in J-Lat 9.2 and 15.4 cells
(A and B) Top: cells were electroporated with Tat (hatched bars) or induced with TNF-α (black bars) and activation of transcription from the 5’ (left diagram) and the 3’LTR (right diagram) was determined using RT-qPCR. Levels represent fold amplification of cDNA from treated (Tat or TNF-α) cells over cDNA from untreated (mock, white bars). Values in different samples were normalized to the GAPDH signal. The results for four RT-qPCR assays are shown ± SEM. Schematic representations of the HIV genome in J-Lat 9.2 and 15.4 cells are presented below the RT-qPCR data. On both LTRs, binding sites for Sp1 and pA sites are marked. Horizontal arrow above the gene designates ongoing transcription from the PP5* and UBA2* promoters. Primers used for amplification of transcripts from the 5’ and 3’LTRs are marked above the scheme. (C and D) RT-PCR was used to determine activation of transcription from the 3’LTR. Schematic representations of a part of the PP5* and UBA2* alleles with numbered exons (black rectangles) and the 3’LTR (white rectangle) are presented on top. Primers used for amplification of fragments from cDNA are marked above the scheme. Bottom panels show agarose gels with fragments obtained by RT-PCR from untreated (-) or TNF-α treated (+) J-Lat 9.2 and 15.4 cells. The primer pairs used are written above the lanes. The right panels represent a normalizing control.
Figure 5
Figure 5. Occupancy of Sp1, RNAPII, PS2-RNAPII and PS5-RNAPII on the HIV genome confirms that transcription from the 5’LTR is inhibited
(A) Schematic representation of the HIV genome in intron 4 of the PP5* gene. Primers used for amplification of immunoprecipitated DNA with qPCR are depicted with arrows above the gene. (B-E) ChIP-qPCR was performed on non-treated (mock, white bars) and TNF-α treated (black bars) J-Lat 9.2 cells. Results are presented as fold enrichment over a no antibody control. DNA was immunoprecipitated with antibodies against Sp1, RNAPII, PS2-RNAPII and PS5-RNAPII as depicted above the panels. The primer pairs used are indicated below the bars. The results for at least three ChIP-qPCR assays are shown ± SEM.
Figure 6
Figure 6. Knockdown of ERα in J-Lat 9.2 cells inhibits transcription from the PP5* promoter and activates transcription from the 5’LTR
(A) Western blotting of endogenous ERα and GAPDH in cellular lysates from J-Lat 9.2, J-Lat 9.2 shER and a control J-Lat 8.4 shER cells as indicated. (B) RT-qPCR with a primer pair amplifying exon 2 of the PP5 gene was used to measure the inhibition of transcription from the PP5 promoter in J-Lat (white bars) and J-Lat shER (black bars) cells as indicated. (C-F) Histograms obtained with FACS of untreated (mock) and TNF-α-treated cells. Cell lines used are indicated on top of the panels. Numbers represent the percentage of GFP-positive cells indicated by horizontal lines.
Figure 7
Figure 7. TNF-α together with HMBA or Tat act synergistically to activate transcription from the 5’LTR
(A-C) Histograms obtained with FACS analysis of J-Lat 9.2, 15.4 and 8.4 cells as indicated on top of the panels. The numbers represent the percentage of GFP-positive cells indicated by horizontal lines. Cells were untreated (mock), treated with HMBA (HMBA), expressed Tat (Tat), treated with TNF-α alone (TNF-α) or in combination with HMBA (HMBA + TNF-α) as shown on top of each histogram. The last histograms on the right represent cells expressing Tat that were treated with TNF-α (Tat + TNF-α). (D) Relative quantity of PP5* (left panel) and UBA2* (right panel) mRNAs in untreated (mock, white bars), TNF-α-treated (black bars), HMBA + TNF-α treated (hatched bars) and cells expressing Tat that were treated with TNF-α (checkered bars) as determined using RT-qPCR. Primer pairs are denoted above the diagrams. Values in different samples were normalized to the GAPDH signal. The results for three RT-qPCR assays are shown ± SEM.

Comment in

References

    1. Bednarik DP, Mosca JD, Raj NB. Methylation as a modulator of expression of human immunodeficiency virus. J Virol. 1987;61:1253–1257. - PMC - PubMed
    1. Cherrington J, Ganem D. Regulation of polyadenylation in human immunodeficiency virus (HIV): contributions of promoter proximity and upstream sequences. Embo J. 1992;11:1513–1524. - PMC - PubMed
    1. Chun TW, Finzi D, Margolick J, Chadwick K, Schwartz D, Siliciano RF. In vivo fate of HIV-1-infected T cells: quantitative analysis of the transition to stable latency. Nat Med. 1995;1:1284–1290. - PubMed
    1. Contreras X, Barboric M, Lenasi T, Peterlin BM. HMBA releases P-TEFb from HEXIM1 and 7SK snRNA via PI3K/Akt and activates HIV transcription. PLoS Pathog. 2007;3:1459–1469. - PMC - PubMed
    1. Contreras X, Lenasi T, Peterlin BM. HIV latency: present knowledge and future directions. Future Virol. 2006;1:733–745. - PMC - PubMed

Publication types