. 2008 Aug 14;4(2):134-46.
doi: 10.1016/j.chom.2008.06.008.

Orientation-dependent regulation of integrated HIV-1 expression by host gene transcriptional readthrough

Affiliations

Orientation-dependent regulation of integrated HIV-1 expression by host gene transcriptional readthrough

Yefei Han et al. Cell Host Microbe. .

Abstract

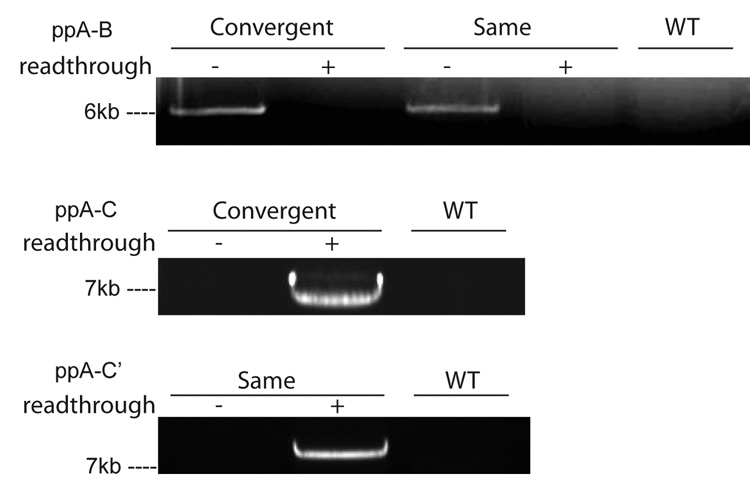
Integrated HIV-1 genomes are found within actively transcribed host genes in latently infected CD4(+) T cells. Readthrough transcription of the host gene might therefore suppress HIV-1 gene expression and promote the latent infection that allows viral persistence in patients on therapy. To address the effect of host gene readthrough, we used homologous recombination to insert HIV-1 genomes in either orientation into an identical position within an intron of an actively transcribed host gene, hypoxanthine-guanine phosphoribosyltransferase (HPRT). Constructs were engineered to permit or block readthrough transcription of HPRT. Readthrough transcription inhibited HIV-1 gene expression for convergently orientated provirus but enhanced HIV-1 gene expression when HIV-1 was in the same orientation as the host gene. Orientation had a >10-fold effect on HIV-1 gene expression. Due to the nature of HIV-1 integration sites in vivo, this orientation-dependent regulation can influence the vast majority of infected cells and adds complexity to the maintenance of latency.


Figures

Fig. 1
Fig. 1
Scheme of system for measuring HIV-1 expression levels under conditions where readthrough transcription can be turned on or off. Using homologous recombination, the HIV-1 genome was inserted into the third intron of the HPRT gene on the X chromosome of the male cell line HCT116. Four clonal cell lines were generated that differed in the orientation of HIV-1 with respect to HRPT transcription (convergent or the same as the host gene HPRT) and on/off status of host gene readthrough due to the presence of a triple polyA signal (Readthrough (+) or Readthrough (−)). Host gene transcription was prematurely terminated by a “stop” site composed of an SV40 triple-polyA signal. The stop signal was flanked by two loxP sites so that it could be removed by Cre/loxP recombination to restore host gene transcriptional readthrough in the Readthrough (+) clones. Solid lines refer to the host gene HPRT, with vertical lines reflecting its exons. The direction of transcription of HPRT and HIV-1 are indicated with black and blue arrows, respectively.
Fig. 2
Fig. 2. Establishment and validation of cell clones containing HIV-1 provirus in the HPRT gene
(a) Experimental outline for the recombination events. Step 1: Homologous recombination. Constructs consisted of six parts: two flanking HPRT homology arms, an internally deleted HIV-1 genome (in either orientation), a selection cassette including a β-geo fusion gene, an SV40 triple polyA “stop” signal, and spacer DNA. They were introduced into the third intron of the HPRT gene by homologous recombination. Step 2: Cre/loxP recombination. The β-geo selection cassette and the “stop” signal were flanked by two loxP sites (marked by stars), and were removed by Cre recombinase to generate Readthrough (+) clones. Primers A, B, C and C’ were used in the genomic DNA PCR to verify the recombination events. (b) Map of the internally deleted HIV-1 genome inserted into HPRT. Two intact LTRs are marked as red arrows. Exons of the functional accessory protein Tat are were marked in orange. Coding regions for the marker genes EGFP and HSA are indicted in green and blue, respectively. Vertical lines point to major splicing sites (SA: splicing acceptor; SD: splicing donor). The distal HIV-1 polyA signal is indicated by a red line. All components are drawn to scale. (c) Verification of recombination events using genomic DNA PCR. Primer sites are marked in Fig 2A. pp refers to specific primer pairs used in the PCR. Bands of the correct size were obtained with the ppA-B for the Readthrough (−) Convergent and Readthrough (−) Same clones indicating the presence of the β-geo selection cassette and the triple polyA “stop” signal (top panel). Using ppA–B, bands were not obtained using template DNA from the Readthrough (+)clones and the control WT HCT116 cells. Using ppA–C and A–C’, bands of the correct size were obtained for Readthrough (+) Convergent and Readthrough (+) Same clones, indicating successful excision of the β-geo selection cassette and the triple polyA “stop” signal (bottom panels). (d) Verification of excision of the β-geo selection cassette and the triple polyA “stop” signal by X-gal staining. Cells were stained before and after the Cre/loxP recombination. Readthrough (−) cells have the β-gal selection marker and were therefore were stained blue (dark in the picture). β-gal was removed by Cre/loxP recombination in Readthrough (+) cells, as indicated by negative X-gal staining. (e) Verification of the termination of HPRT transcription by the triple polyA signal. HPRT mRNA levels measure by realtime RT-PCR. PCR primers (marked as arrows) were placed in the two HPRT exons (exons 3 and 4) flanking the intron containing the HIV-1 genome. The probe (marked as a short line) was located at the junction of the two exons. The upper panel shows the predicted the processing of HPRT mRNAs, with removal of the third intron by splicing in the wild type (WT) and Readthrough (+) cells and termination of transcription in the Readthrough (−) clones. The lower panel shows realtime RT-PCR results from the sample and control cells. In both Readthrough (−) Convergent and Readthrough (−) Same cells , HPRT mRNA was undetectable (*) using primers in exons 3 and 4.
Fig. 3
Fig. 3. Effect of readthrough transcription of expression of HIV-1 proviruses integrated in the convergent orientation
(a) HIV-1 transcription was measure by realtime RT-PCR amplification of a segment of the HIV-1 gag gene from the mRNA of the Readthrough (−) Convergent and Readthrough (+) Convergent cells. The amount of GAPDH mRNA was used to normalize the cell number in each sample. (*) indicates statistical significance (P<0.05) using one tailed t-test. (b) FACS analysis of GFP expression in WT, Readthrough (−) Convergent, and Readthrough (+) Convergent cells. (c) Quantification of the same segment of the HIV-1 gag gene in Readthrough (−) Convergent and Readthrough (+) Convergent cells following TNF-α activation, transfection with Tat, or both treatments.
Fig. 4
Fig. 4. Effect of readthrough transcription of expression of HIV-1 proviruses integrated in the same orientation as HPRT
(a) Quantification of HIV-1 mRNA in the Readthrough (−) Same and Readthrough (+) Same cells. The amount of GAPDH mRNA was used to normalize the cell number in each sample. (*) indicates statistical significance (P<0.05) using one tailed t-test. (b) FACS analysis of GFP expression in WT, Readthrough (−) Same, and Readthrough (+) Same cells. (c) Quantification of the same segment of the HIV-1 gag gene in Readthrough (−) Same and Readthrough (+) Same cells following TNF-α activation, transfection with Tat, or both treatments.
Fig. 5
Fig. 5. ChIP analysis of the effect of readthrough transcription on occupancy of the HIV-1 promoter
(a) Promoter occupancy for HIV-1 in the convergent orientation. The occupancy of the HIV-1 promoter by the components crucial for HIV-1 transcription was reduced by host gene transcription readthrough when HIV-1 and the host gene were in the convergent orientation. ChIP assays were carried out using specific antibodies to total RNA polII, phosphorylated RNA polII, TBP, TFIIH(p62), NFκB, SP1, and CDK9. After crosslinking and immunoprecipitation, the −116 to +4 region corresponding to the HIV-1 promoter was amplified from Readthrough (−) Convergent cells (black bars) and Readthrough (+) Convergent cells (white bars). The occupancy of each protein on the relevant control promoter was measured simultaneously. (b) Promoter occupancy for HIV-1 in the same orientation as HPRT. ChIP analysis for the HIV-1 promoter occupancy in the Readthrough (−) Same cells (white bars) and Readthrough (+) Same cells (black bars) was performed as described above.
Fig. 6
Fig. 6. Effect of readthrough transcription on histone modifications at the HIV-1 LTR
Histone modifications in the vicinity of the integrated provirus were analyzed by ChIP assays using antibodies to H3K9,14Ac, H3K27me3 and H3K36me3 for precipitation followed by amplification of the region (+437 to + 543) downstream of the transcriptional start site of HIV-1. (a)(c) Differences between the Readthrough (−) Convergent and the Readthrough (+) Convergent cells in levels of H3K9,14Ac, H3K27me3 and H3K36me3, respectively. (d)(f) Differences between the Readthrough (−) Same and the Readthrough (+) Same cells in H3K9,14Ac, H3K27me3 and H3K36me3, respectively. The white bars refer to the Readthrough (−) cells, and the black bars to the Readthrough (+) cells.
Fig. 7
Fig. 7. Summary of the orientation-dependent regulation of HIV-1 gene expression by host readthrough transcription
(a) Quantification of HIV-1 gene expression at an identical site within an actively transcribing host gene (HPRT) by realtime RT-PCR. Orientation relative to the host gene has a >10 fold effect and on the steady-state level of HIV-1 transcription. The effect was statistically significant (*, P=0.02). (b) FACS analysis showed a >1 log difference in the mean intensity of the LTR-driven GFP expression between Readthrough (+) Same and Readthrough (+) Convergent cells (c) Host gene transcriptional readthrough mediates orientation-dependent regulation: inhibitory when HIV-1 and the host gene are in the convergent orientation; enhancing when they are in the same orientation.

References

    1. Initial sequencing and analysis of the human genome. Nature. 2001;409:860–921. - PubMed
    1. Abarrategui IKMS. Noncoding transcription controls downstream promoters to regulate T-cell receptor alpha recombination. EMBO J. 2007;26:4380–4390. - PMC - PubMed
    1. Adams M, Sharmeen L, Kimpton J, Romeo JM, Garcia JV, Peterlin BM, Groudine M, Emerman M. Cellular latency in human immunodeficiency virus-infected individuals with high CD4 levels can be detected by the presence of promoter-proximal transcripts. Proc. Natl. Acad. Sci. U. S. A. 1994;91:3862–3866. - PMC - PubMed
    1. Adhya S, Gottesman M. Promoter occlusion: Transcription through a promoter may inhibit its activity. Cell. 1982;29:939–944. - PubMed
    1. Alami R, Greally JM, Tanimoto K, Hwang S, Feng YQ, Engel JD, Fiering S, Bouhassira EE. {beta}-globin YAC transgenes exhibit uniform expression levels but position effect variegation in mice. Hum. Mol. Genet. 2000;9:631–636. - PubMed

Publication types

Substances