. 2008 Aug;15(2):261-71.
doi: 10.1016/j.devcel.2008.07.002.

The endothelial-specific microRNA miR-126 governs vascular integrity and angiogenesis

Affiliations

The endothelial-specific microRNA miR-126 governs vascular integrity and angiogenesis

Shusheng Wang et al. Dev Cell. 2008 Aug.

Abstract

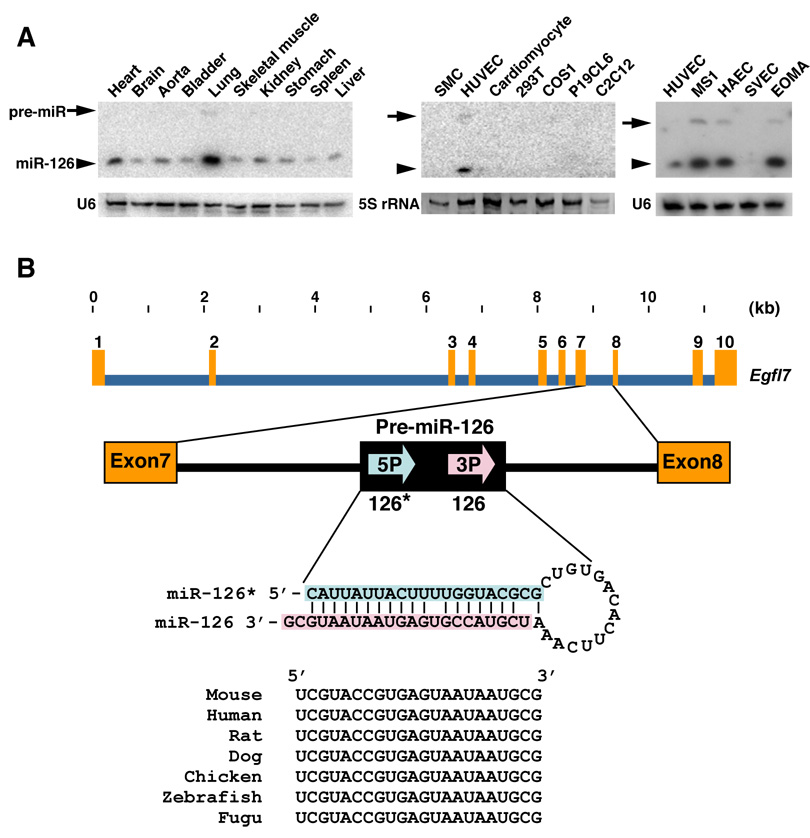
Endothelial cells play essential roles in maintenance of vascular integrity, angiogenesis, and wound repair. We show that an endothelial cell-restricted microRNA (miR-126) mediates developmental angiogenesis in vivo. Targeted deletion of miR-126 in mice causes leaky vessels, hemorrhaging, and partial embryonic lethality, due to a loss of vascular integrity and defects in endothelial cell proliferation, migration, and angiogenesis. The subset of mutant animals that survives displays defective cardiac neovascularization following myocardial infarction. The vascular abnormalities of miR-126 mutant mice resemble the consequences of diminished signaling by angiogenic growth factors, such as VEGF and FGF. Accordingly, miR-126 enhances the proangiogenic actions of VEGF and FGF and promotes blood vessel formation by repressing the expression of Spred-1, an intracellular inhibitor of angiogenic signaling. These findings have important therapeutic implications for a variety of disorders involving abnormal angiogenesis and vascular leakage.


Figures

Figure 1
Figure 1. Endothelial cell-specific expression and gene structure of miR-126
(A) Expression of miR-126 in different tissues and cell lines, as detected by Northern blot. U6 or 5S rRNA serve as a loading control. Arrows indicate the position of pre-miR-126, and arrowheads indicate the mature miR-126. SMC: mouse smooth muscle cell line; HUVEC: human umbilical vein endothelial cell (EC) line; P19CL6: derivative of P19 embryonic carcinoma cells; C2C12: mouse myoblast cell line. MS1: mouse primary islet ECs transformed with SV40 large T antigen; HAEC: human aortic ECs; SVEC: SV40 transformed mouse EC line; and EOMA: mouse hemangioendothelioma-derived line. (B) Structure of the mouse Egfl7 gene. miR-126 (miR-126-3p) and miR-126* (miR-126-5p) are generated as a stem loop encoded by intron 7. Evolutionary conservation of miR-126 is shown.
Figure 2
Figure 2. Cis-regulatory sequences that direct endothelial-specific expression of Egfl7/miR-126
(A) E12.5 transgenic mouse embryo harboring a lacZ transgene controlled by 5.4kb 5’ flanking DNA upstream of the Egfl7/miR-126 gene. EC specific lacZ expression showing a) whole mount embryo, and sagittal section in b) perichondral region, c) dermis, d) brain, and e) outflow tract. Scale bar equals 50um. (B) Schematic diagrams of genomic regions upstream of the Egfl7/miR-126 gene tested for regulation of lacZ in transgenic mice at E12.5. The fraction of transgenic embryos showing endothelial-specific expression of lacZ is shown. Evolutionary conservation of the Egfl7/miR-126 5’ flanking region is shown below. The conserved ETS binding sites are highlighted in pink and light blue. (C) Genomic fragment for regulatory region 1(Region1-Luc) was tested for activation by increasing amounts of an expression plasmid encoding Ets1 or Ets1 mutant lacking the DNA binding domain (Ets1mut) in COS-7 cells. A deletion mutation was introduced into the ETS binding site (Region1(mut)-Luc). Ets1 activated Region1-Luc but not Region1(mut)-Luc, while Ets1mut failed to activate either construct.
Figure 3
Figure 3. Targeting of the miR-126 gene
(A) Strategy to generate miR-126 mutant mice by homologous recombination. The 96bp Egfl7 intron 7 sequence, which contains miR-126, was replaced with a neomycin resistance cassette (Neo) flanked by loxP sites. Neo was removed in the mouse germ line by crossing heterozygous mice to CAG-Cre transgenic mice. DTA, diphtheria toxin A. (B) Southern blot analysis of genomic DNA from ES cells. DNA was digested with Sca I. Using either the 5’ probe or 3’ probe, the sizes of the wild-type and mutant (miR-126neo allele) are 11.4kb and 13.4kb, respectively. Genotypes are shown on the top. (C) Analysis of Egfl7 transcripts in heart (left panel) or lung (right panel) of miR-126neo/neo or miR126−/− mice, as detected by RT-PCR. The Egfl7 gene structure and the exon numbers are shown on the bottom. Primers used for RT-PCR were named based on the exon number in the forward (F) and reverse (R) direction. Genotypes are shown on the top. GAPDH was used as a control. Note that Egfl7 expression is disrupted in the miR-126neo/neo mutants, as shown by RT-PCR with primers 7F and 8R, 6F and 9R, 8F and 10R; and normalized upon deletion of the neo cassette, as shown by RT-PCR with the primers indicated. (D) Detection of EGFL7 and GAPDH protein by Western blot of heart extracts from WT and miR-126 KO mice. (E) Detection of miR-126 transcripts by Northern analysis of hearts and lungs. 5S rRNA serves as a loading control. (F) Genotypes of offspring from miR-126+/− intercrosses. The actual and expected number of mice for each genotype at the indicated stages is shown. (G) Genotypes of embryos from miR-126+/− intercrosses. The number of miR-126−/− offspring analyzed at each age is shown. Severe vascular defects were defined as edema, hemorrhage, severe growth retardation and lethality. Less than 1% of wild-type or miR-126+/− embryos or neonates showed vascular abnormalities.
Figure 4
Figure 4. Vascular abnormalities in miR-126 null mice
(A) Wild-type (WT) and miR-126−/− (KO) embryos at E15.5. A subset of KO embryos shows systemic edema and hemorrhages as indicated by the arrows. (B) Lateral views of cranial regions of WT and miR-126 KO embryos at E10.5. Superficial cranial vessels, shown by arrowheads, are apparent in WT embryos, but are severely deficient in the mutant. The number of vessels in the cranial region indicated by boxes, is shown on the right (n=6). (C) Vascularization of the retina at P2, as visualized by PECAM staining. The position of the central retinal artery is demarcated by dashed white lines and the termini of retinal vessels in the mutant by red arrows. Bar = 200 um. Relative vascular coverage is shown on the right (n=3). (D) H&E staining of sagittal sections of the dermis and liver of E15.5 embryos and lung of neonates of the indicated genotypes. Scale bar in the upper and middle panel equals 200um, and scale bar in the bottom panel equals 500um. The bracket indicates the thickening of dermis with erythrocytes and inflammatory cells in the tissue space in the KO embryo. The arrowheads indicate congestion of red blood cells in KO liver compared to the WT liver. The arrows point to the lungs, in which the alveoli fail to inflate in the KO mice. Asterisks show edema in the thoracic cavity in KO neonates. (E) Electron microscopy of capillaries in WT and KO embryos at E15.5. The bracket shows the breakdown of vessels in KO embryos. The green arrows point to tight junctions in WT endothelial cells. The red arrow points to the red blood cells floating outside of the vessels in KO embryos, while the arrow head indicates the thinning of the endothelial layer in the vessel of KO embryo. EC: endothelial cell; rbc: red blood cell. (F) Endothelial cell proliferation in E15.5 KO embryos. Significantly less BrdU (red) and PECAM1 (green) double positive cells were observed in KO compared to WT embryos. The red arrow points to the PECAM/BrdU double positive cells, while the white arrow points to the PECAM single positive cells. Nuclei were stained with DAPI (blue). The statistics are shown on the bar graph (p=0.014).
Figure 5
Figure 5. Impaired angiogenesis of miR-126 KO ECs
(A) Representative images of cultured aortic rings isolated from wild-type (WT) and miR-126−/− (KO) mice at days 4–6 are shown. Extensive endothelial outgrowth can be seen in WT explants, but not in mutants. Relative migratory activity under each condition was quantified as shown in the bar graphs with statistics. (B) Representative images of PECAM1 (Green) staining of matrigel plugs implanted into mice of the indicated genotypes are shown. Significant less angiogenesis was observed in the matrigel with FGF-2 in KO mice compared to WT mice. No significant angiogenesis was observed in the matrigel plugs with lacking FGF-2 in WT or KO mice. Scale bar equals 60um. (C) The extent of angiogenesis in the matrigel plug assay was quantified by determining PECAM staining area using Image J software. P = 0.0008 for KO compared to WT matrigel plugs. (D) Survival of WT and KO mice following MI. P value equals 0.05 and 0.014 for the survival of KO mice compared to WT for 1 week and 3 week post MI. (E) Histological analysis of hearts from WT and KO mice following MI. Panels a–d show longitudinal sections through the right ventricle (RV) and left ventricle (LV). Note thrombi in the atria of the mutant heart, indicative of heart failure. Panels e and f show transverse sections stained with Masson’s trichrome to reveal scar formation. Note the extensive loss of myocardium in the KO mice. Panels g and h show PECAM1 staining in the boxed infarct region from e and f. Note the deficiency of vasculature in KO mice following MI. The scale bar in a–f equals 1cm, and the scale bar in g and h equals 40um.
Figure 6
Figure 6. Modulation of angiogenic growth factor signaling by miR-126
(A) miR-126 enhances FGF-dependent phosphorylation of ERK1/2. HUVEC cells were infected with adenovirus expressing lacZ or miR-126, and treated with FGF-2 (10ng/ml) for the indicated periods of time. Cell lysates were immunoblotted with the indicated antibodies to determine the level of phosphorylated and total ERK1/2. Ad-miR-126 enhanced FGF-2 dependent phosphorylation of ERK1/2. (B) Knockdown of miR-126 diminishes VEGF-dependent phosphorylation of ERK1/2. HAEC cells were transfected with 2’-O-methyl-miR-126 antisense oligonucleotide or control oligonucleotide, and treated with VEGF (10ng/ml) for 10 min. Cell lysates were immunoblotted with the indicated antibodies to determine the level of phosphorylated and total ERK1/2. GAPDH was used as a loading control. (C) Sequence alignment of miR-126 with Spred-1 3’ untranslated regions (UTRs) from different species. (D) Detection of Spred-1, CRK and GAPDH protein by Western Blot of yolk sac extracts of E15.5 WT and miR-126 KO embryos. (E) miR-126 targets the Spred-1 3’ UTR. The 3’ UTR of Spred-1 mRNA, and the Spred-1m 3’ UTR with mutations engineered in the region complementary to the miR-126 seed region (GGTACGA to TTGGAAG), was inserted into the pMIR-REPORT vector (Ambion). The miR-126 mutant (miR-126m) construct consists of the miR-126-3p sequence CGTACC mutated to GCATGG, and the corresponding miR-126-5p sequence GGTACG mutated to CCATGC. Transfection of COS-7 cells was performed using the indicated combination of plasmids. CMV-βGAL was used as an internal control for transfection efficiency. Error bars indicate standard deviation. The P values are shown. ns, not significant. (F) Relative Spred-1 mRNA expression level upon miR-126 over-expression or knockdown. HUVEC or HAEC cells were subjected to the indicated treatments, and the level of Spred-1 mRNA was determined by Real-time RT-PCR. GAPDH served as a control. Error bars indicate standard deviation. The P values are shown. (G) Up-regulation of Spred-1 mRNA in miR-126−/− endothelial cells. The level of Spred-1 mRNA was determined by Real-time RT-PCR with L7 as control. Error bars indicate standard deviation. P=0.01 for KO compared to WT. (H) Representative images of cultured aortic rings isolated from wild-type (WT) and miR-126 KO mice at days 5 and 6 are shown. Adenoviral over-expression of Spred-1 in WT explants impairs endothelial outgrowth, whereas siRNA-mediated knockdown of Spred-1 in explants from miR-126 KO mice enhances endothelial outgrowth. Relative migratory activity under each condition was quantified as shown in the bar graphs with statistics. (I) Scratch-wound assay of HUVEC cells response to VEGF. Knockdown of miR-126 expression with anti-sense RNA impairs EC migration, whereas knockdown of Spred-1 with siRNA restores migration in the presence of miR-126 antisense RNA. The edges of the scratch-wound are shown by red dashed lines.
Figure 7
Figure 7. A model for the function of miR-126 in angiogenesis
Binding of VEGF and FGF to their receptors on ECs leads to activation of the MAP kinase signaling pathway, which culminates in the nucleus to stimulate the transcription of genes involved in angiogenesis. miR-126 represses the expression of Spred-1, a negative regulator of Ras/MAP kinase signaling. Thus, loss of miR-126 function diminishes MAP kinase signaling in response to VEGF and FGF, whereas gain of miR-126 function enhances angiogenic signaling.

References

    1. Bartel DP. MicroRNAs: genomics, biogenesis, mechanism, and function. Cell. 2004;116:281–297. - PubMed
    1. Campagnolo L, Leahy A, Chitnis S, Koschnick S, Fitch MJ, Fallon JT, Loskutoff D, Taubman MB, Stuhlmann H. EGFL7 is a chemoattractant for endothelial cells and is up-regulated in angiogenesis and arterial injury. Am. J. Pathol. 2005;167:275–284. - PMC - PubMed
    1. Carmeliet P. Angiogenesis in health and disease. Nat. med. 2003;9:653–660. - PubMed
    1. Chang SR, Bezprozvannaya S, Li SJ, Olson EN. An expression screen reveals modulators of class II histone deacetylase phosphorylation. Proc. Natl. Acad. Sci. U S A. 2005;102:8120–8125. - PMC - PubMed
    1. Chang SR, Young BD, Li SJ, Qi XX, Richardson JA, Olson EN. Histone deacetylase 7 maintains vascular integrity by repressing matrix metalloproteinase 10. Cell. 2006;126:321–334. - PubMed

Publication types

MeSH terms