

Integration of small-angle X-ray scattering data into structural modeling of proteins and their assemblies
- PMID: 18694757
- PMCID: PMC2745287
- DOI: 10.1016/j.jmb.2008.07.074
Integration of small-angle X-ray scattering data into structural modeling of proteins and their assemblies
Abstract
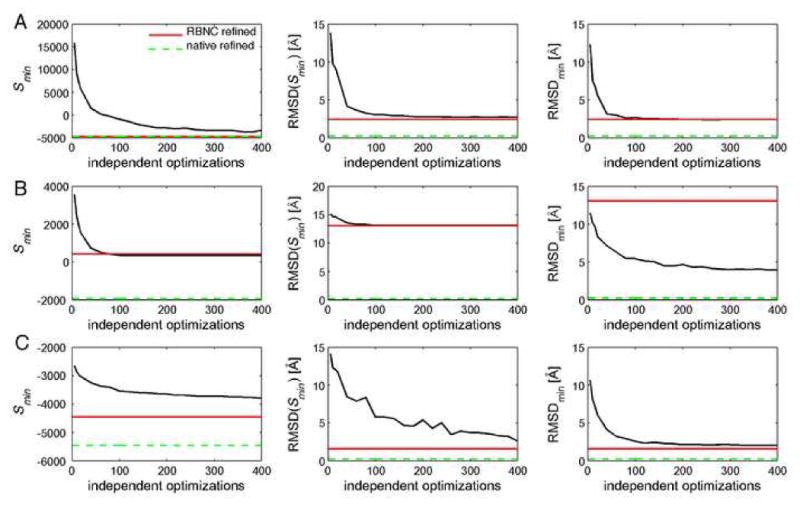
A major challenge in structural biology is to determine the configuration of domains and proteins in multidomain proteins and assemblies, respectively. All available data should be considered to maximize the accuracy and precision of these models. Small-angle X-ray scattering (SAXS) efficiently provides low-resolution experimental data about the shapes of proteins and their assemblies. Thus, we integrated SAXS profiles into our software for modeling proteins and their assemblies by satisfaction of spatial restraints. Specifically, we modeled the quaternary structures of multidomain proteins with structurally defined rigid domains as well as quaternary structures of binary complexes of structurally defined rigid proteins. In addition to SAXS profiles and the component structures, we used stereochemical restraints and an atomic distance-dependent statistical potential. The scoring function is optimized by a biased Monte Carlo protocol, including quasi-Newton and simulated annealing schemes. The final prediction corresponds to the best scoring solution in the largest cluster of many independently calculated solutions. To quantify how well the quaternary structures are determined based on their SAXS profiles, we used a benchmark of 12 simulated examples as well as an experimental SAXS profile of the homotetramer D-xylose isomerase. Optimization of the SAXS-dependent scoring function generally results in accurate models if sufficiently precise approximations for the constituent rigid bodies are available; otherwise, the best scoring models can have significant errors. Thus, SAXS profiles can play a useful role in the structural characterization of proteins and assemblies if they are combined with additional data and used judiciously. Our integration of a SAXS profile into modeling by satisfaction of spatial restraints will facilitate further integration of different kinds of data for structure determination of proteins and their assemblies.
Figures


Similar articles
-
Accurate SAXS profile computation and its assessment by contrast variation experiments.Biophys J. 2013 Aug 20;105(4):962-74. doi: 10.1016/j.bpj.2013.07.020. Biophys J. 2013. PMID: 23972848 Free PMC article.
-
Hybrid Methods for Modeling Protein Structures Using Molecular Dynamics Simulations and Small-Angle X-Ray Scattering Data.Adv Exp Med Biol. 2018;1105:237-258. doi: 10.1007/978-981-13-2200-6_15. Adv Exp Med Biol. 2018. PMID: 30617833 Review.
-
SAXSDom: Modeling multidomain protein structures using small-angle X-ray scattering data.Proteins. 2020 Jun;88(6):775-787. doi: 10.1002/prot.25865. Epub 2019 Dec 27. Proteins. 2020. PMID: 31860156 Free PMC article.
-
FoXS, FoXSDock and MultiFoXS: Single-state and multi-state structural modeling of proteins and their complexes based on SAXS profiles.Nucleic Acids Res. 2016 Jul 8;44(W1):W424-9. doi: 10.1093/nar/gkw389. Epub 2016 May 5. Nucleic Acids Res. 2016. PMID: 27151198 Free PMC article.
-
Structural characterization of proteins and complexes using small-angle X-ray solution scattering.J Struct Biol. 2010 Oct;172(1):128-41. doi: 10.1016/j.jsb.2010.06.012. Epub 2010 Jun 15. J Struct Biol. 2010. PMID: 20558299 Review.
Cited by
-
Solution structure of the Atg1 complex: implications for the architecture of the phagophore assembly site.Structure. 2015 May 5;23(5):809-818. doi: 10.1016/j.str.2015.02.012. Epub 2015 Mar 26. Structure. 2015. PMID: 25817386 Free PMC article.
-
Fast-SAXS-pro: a unified approach to computing SAXS profiles of DNA, RNA, protein, and their complexes.J Chem Phys. 2013 Jan 14;138(2):024112. doi: 10.1063/1.4774148. J Chem Phys. 2013. PMID: 23320673 Free PMC article.
-
Ku and DNA-dependent protein kinase dynamic conformations and assembly regulate DNA binding and the initial non-homologous end joining complex.J Biol Chem. 2010 Jan 8;285(2):1414-23. doi: 10.1074/jbc.M109.065615. Epub 2009 Nov 5. J Biol Chem. 2010. PMID: 19893054 Free PMC article.
-
SoftWAXS: a computational tool for modeling wide-angle X-ray solution scattering from biomolecules.J Appl Crystallogr. 2009 Oct 1;42(Pt 5):932-943. doi: 10.1107/S0021889809032919. Epub 2009 Sep 8. J Appl Crystallogr. 2009. PMID: 21339902 Free PMC article.
-
Characterization of protein flexibility using small-angle x-ray scattering and amplified collective motion simulations.Biophys J. 2014 Aug 19;107(4):956-64. doi: 10.1016/j.bpj.2014.07.005. Biophys J. 2014. PMID: 25140431 Free PMC article.
References
-
- Sali A, Glaeser R, Earnest T, Baumeister W. From words to literature in structural proteomics. Nature. 2003;422:216–25. - PubMed
-
- Robinson CV, Sali A, Baumeister W. The molecular sociology of the cell. Nature. 2007;450:973–82. - PubMed
-
- Alber F, Förster F, Korkin K, Topf M, Sali A. Integrating Diverse Data for Structure Determination of Macromolecular Assemblies. Annu Rev Biochem. 2008 in press. - PubMed
-
- Doniach S. Changes in biomolecular conformation seen by small angle X-ray scattering. Chem Rev. 2001;101:1763–78. - PubMed
-
- Koch MH, Vachette P, Svergun DI. Small-angle scattering: a view on the properties, structures and structural changes of biological macromolecules in solution. Q Rev Biophys. 2003;36:147–227. - PubMed
Publication types
MeSH terms
Substances
Grants and funding
LinkOut - more resources
Full Text Sources
