Willingness of patients to change surgeons for a shorter waiting time for joint arthroplasty
- PMID: 18695180
- PMCID: PMC2492973
- DOI: 10.1503/cmaj.071659
Willingness of patients to change surgeons for a shorter waiting time for joint arthroplasty
Abstract
Background: To improve access to care, many jurisdictions have proposed waiting-time benchmarks and guarantees. We assessed the willingness of patients to consider changing their surgeon to one with a shorter waiting time for arthroplasty.
Methods: We mailed a questionnaire to 2 random samples of patients who either were awaiting hip or knee replacement arthroplasty or had had one of these procedures within the preceding 3-12 months. We used logistic regression to assess the determinants of patients' likelihood to consider changing surgeons.
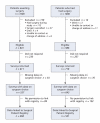
Results: Of 1200 responses from a sample of 2000, 557 (46%) were from patients awaiting surgery and 643 (54%) were from people who had undergone surgery. The mean age of respondents was 69.9 years (standard deviation 10.8), and 682 (57%) were women. The median waiting time for surgery was 8 months. Overall, 753 (63%) of the patients were unlikely to consider changing surgeons. Increased likelihood of changing surgeons was associated with male sex (adjusted odds ratio [OR] 1.49, 95% confidence interval [CI] 1.10-2.02), a high school education or higher (OR 1.73, 95% CI 1.15-2.62) and having already undergone surgery (OR 1.71, 95% CI 1.19-2.46). Decreased likelihood was associated with preference for a particular surgeon before referral (OR 0.57, 95% CI 0.42-0.79), a better score on the EuroQol (EQ-5D) index (a measure of health-related quality of life) (OR 0.39, 95% CI 0.24-0.66), perception that the waiting time to see the surgeon was acceptable (OR 0.50, 95% CI 0.36-0.70), perception that the waiting time to surgery was acceptable (OR 0.62, 95% CI 0.43-0.91) and perceived fairness of treatment (OR 0.53, 95% CI 0.36-0.78).
Interpretation: Despite long waits for surgery, most patients, if given the choice, would be unlikely to change their surgeon to one with a shorter waiting time.
Figures


Similar articles
-
A bird can't fly on one wing: patient views on waiting for hip and knee replacement surgery.Health Expect. 2007 Jun;10(2):108-16. doi: 10.1111/j.1369-7625.2006.00425.x. Health Expect. 2007. PMID: 17524004 Free PMC article.
-
The importance of patient expectations as a determinant of satisfaction with waiting times for hip and knee replacement surgery.Health Policy. 2011 Aug;101(3):245-52. doi: 10.1016/j.healthpol.2011.05.011. Epub 2011 Jun 15. Health Policy. 2011. PMID: 21680042
-
'Worse than death' and waiting for a joint arthroplasty.Bone Joint J. 2019 Aug;101-B(8):941-950. doi: 10.1302/0301-620X.101B8.BJJ-2019-0116.R1. Bone Joint J. 2019. PMID: 31362549 Free PMC article. Clinical Trial.
-
Results of total joint arthroplasty and joint preserving surgery in younger patients evaluated by alternative outcome measures.Dan Med J. 2014 Apr;61(4):B4836. Dan Med J. 2014. PMID: 24814600 Review.
-
The functional and psychological impact of delayed hip and knee arthroplasty: a systematic review and meta-analysis of 89,996 patients.Sci Rep. 2024 Apr 5;14(1):8032. doi: 10.1038/s41598-024-58050-6. Sci Rep. 2024. PMID: 38580681 Free PMC article.
Cited by
-
Waiting for surgery from the patient perspective.Psychol Res Behav Manag. 2009;2:107-19. doi: 10.2147/prbm.s7652. Epub 2009 Oct 14. Psychol Res Behav Manag. 2009. PMID: 22110325 Free PMC article.
-
Determinants of demand for total hip and knee arthroplasty: a systematic literature review.BMC Health Serv Res. 2012 Jul 30;12:225. doi: 10.1186/1472-6963-12-225. BMC Health Serv Res. 2012. PMID: 22846144 Free PMC article.
-
The effects of publishing emergency department wait time on patient utilization patterns in a community with two emergency department sites: a retrospective, quasi-experiment design.Int J Emerg Med. 2011 Jun 14;4(1):29. doi: 10.1186/1865-1380-4-29. Int J Emerg Med. 2011. PMID: 21672236 Free PMC article.
-
Canadian valuation of EQ-5D health states: preliminary value set and considerations for future valuation studies.PLoS One. 2012;7(2):e31115. doi: 10.1371/journal.pone.0031115. Epub 2012 Feb 6. PLoS One. 2012. PMID: 22328929 Free PMC article.
-
A single-entry model and wait time for hip and knee replacement in eastern health region of Newfoundland and Labrador 2011-2019.BMC Health Serv Res. 2022 Jan 16;22(1):82. doi: 10.1186/s12913-021-07451-8. BMC Health Serv Res. 2022. PMID: 35034657 Free PMC article.
References
-
- Access to health care services in Canada. Ottawa (ON): Statistics Canada; 2006.
-
- Hanning M, Spangberg UW. Maximum waiting time — A threat to clinical freedom? Implementation of a policy to reduce waiting times. Health Policy 2000;52:15-32. - PubMed
-
- Siciliani L, Hurst J. Tackling excessive waiting times for elective surgery: a comparative analysis of policies in 12 OECD countries. Health Policy 2005;72:201-15. - PubMed
-
- Ostendorf M, Buskens E, van Stel H, et al. Waiting for total hip arthroplasty: avoidable loss in quality time and preventable deterioration. J Arthroplasty 2004;19:302-9. - PubMed
Publication types
MeSH terms
LinkOut - more resources
Full Text Sources
Medical
