

Colloquium paper: phylogenetic trees and the future of mammalian biodiversity
- PMID: 18695230
- PMCID: PMC2556418
- DOI: 10.1073/pnas.0801917105
Colloquium paper: phylogenetic trees and the future of mammalian biodiversity
Abstract
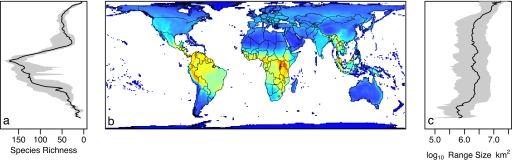
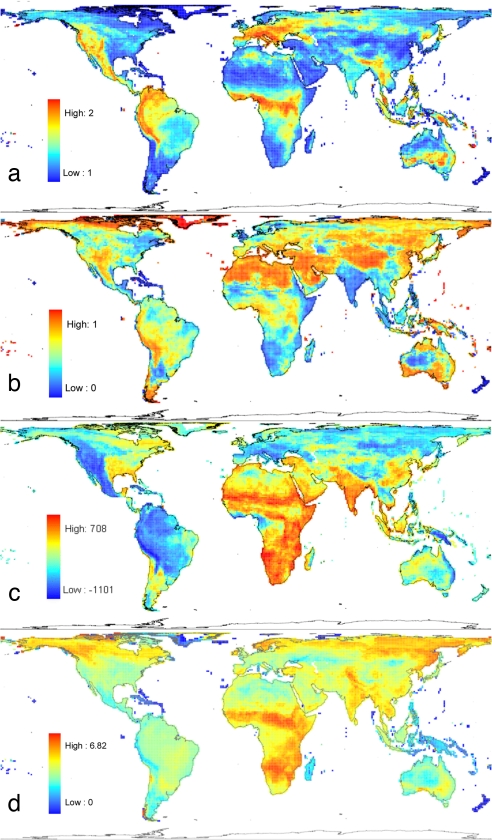
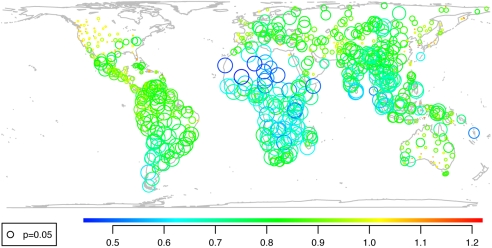
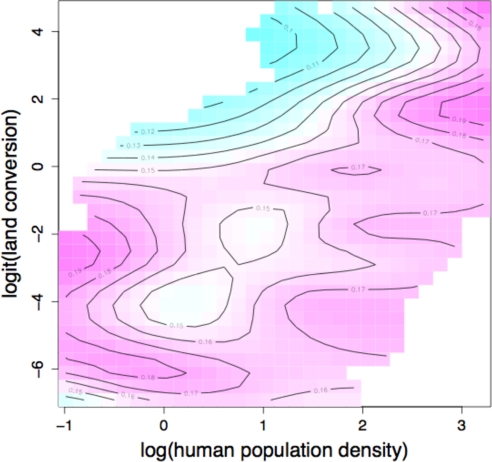
Phylogenies describe the origins and history of species. However, they can also help to predict species' fates and so can be useful tools for managing the future of biodiversity. This article starts by sketching how phylogenetic, geographic, and trait information can be combined to elucidate present mammalian diversity patterns and how they arose. Recent diversification rates and standing diversity show different geographic patterns, indicating that cradles of diversity have moved over time. Patterns in extinction risk reflect both biological differences among mammalian lineages and differences in threat intensity among regions. Phylogenetic comparative analyses indicate that for small-bodied mammals, extinction risk is governed mostly by where the species live and the intensity of the threats, whereas for large-bodied mammals, ecological differences also play an important role. This modeling approach identifies species whose intrinsic biology renders them particularly vulnerable to increased human pressure. We outline how the approach might be extended to consider future trends in anthropogenic drivers, to identify likely future battlegrounds of mammalian conservation, and the likely casualties. This framework could help to highlight consequences of choosing among different future climatic and socioeconomic scenarios. We end by discussing priority-setting, showing how alternative currencies for diversity can suggest very different priorities. We argue that aiming to maximize long-term evolutionary responses is inappropriate, that conservation planning needs to consider costs as well as benefits, and that proactive conservation of largely intact systems should be part of a balanced strategy.
Conflict of interest statement
The authors declare no conflict of interest.
Figures
References
-
- Harvey PH, Leigh Brown AJ, Maynard Smith J, Nee S. New Uses For New Phylogenies. Oxford: Oxford Univ Press; 1996.
-
- Bininda-Emonds ORP. The evolution of supertrees. Trends Ecol Evol. 2004;19:316–322. - PubMed
-
- Cracraft J, Donoghue MJ. Assembling the Tree of Life. Oxford: Oxford Univ Press; 2004.
-
- Millennium Ecosystem Assessment. Ecosystems and Human Well-Being: Biodiversity Synthesis. Washington DC: World Resources Institute; 2005.
-
- Jablonski D. Extinctions in the fossil record. Phil Trans R Soc London Ser B. 1994;344:11–16.
Publication types
MeSH terms
LinkOut - more resources
Full Text Sources
