

Southern Ocean frontal structure and sea-ice formation rates revealed by elephant seals
- PMID: 18695241
- PMCID: PMC2575336
- DOI: 10.1073/pnas.0800790105
Southern Ocean frontal structure and sea-ice formation rates revealed by elephant seals
Abstract
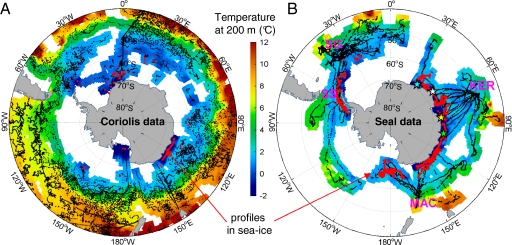
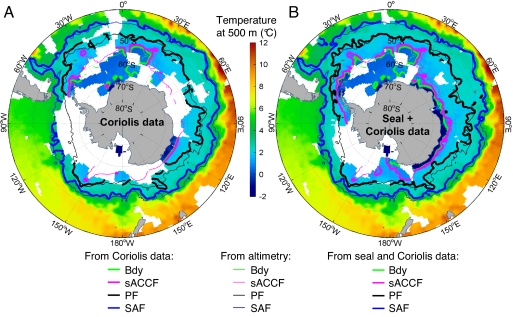
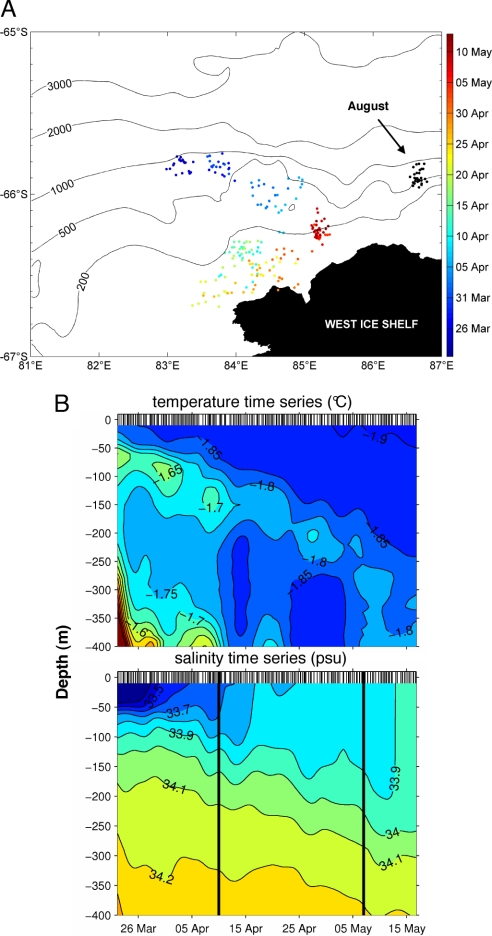
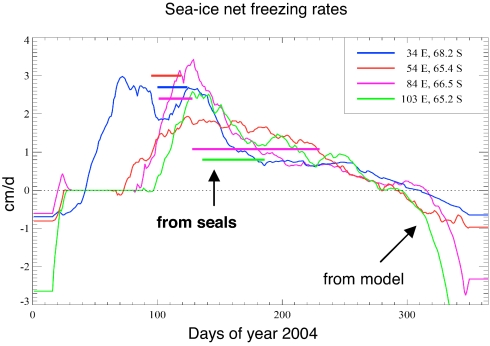
Polar regions are particularly sensitive to climate change, with the potential for significant feedbacks between ocean circulation, sea ice, and the ocean carbon cycle. However, the difficulty in obtaining in situ data means that our ability to detect and interpret change is very limited, especially in the Southern Ocean, where the ocean beneath the sea ice remains almost entirely unobserved and the rate of sea-ice formation is poorly known. Here, we show that southern elephant seals (Mirounga leonina) equipped with oceanographic sensors can measure ocean structure and water mass changes in regions and seasons rarely observed with traditional oceanographic platforms. In particular, seals provided a 30-fold increase in hydrographic profiles from the sea-ice zone, allowing the major fronts to be mapped south of 60 degrees S and sea-ice formation rates to be inferred from changes in upper ocean salinity. Sea-ice production rates peaked in early winter (April-May) during the rapid northward expansion of the pack ice and declined by a factor of 2 to 3 between May and August, in agreement with a three-dimensional coupled ocean-sea-ice model. By measuring the high-latitude ocean during winter, elephant seals fill a "blind spot" in our sampling coverage, enabling the establishment of a truly global ocean-observing system.
Conflict of interest statement
The authors declare no conflict of interest.
Figures
Similar articles
-
Ecology of southern ocean pack ice.Adv Mar Biol. 2002;43:171-276. doi: 10.1016/s0065-2881(02)43005-2. Adv Mar Biol. 2002. PMID: 12154613 Review.
-
Bio-physical characterisation of polynyas as a key foraging habitat for juvenile male southern elephant seals (Mirounga leonina) in Prydz Bay, East Antarctica.PLoS One. 2017 Sep 13;12(9):e0184536. doi: 10.1371/journal.pone.0184536. eCollection 2017. PLoS One. 2017. PMID: 28902905 Free PMC article.
-
Decadal changes in habitat characteristics influence population trajectories of southern elephant seals.Glob Chang Biol. 2017 Dec;23(12):5136-5150. doi: 10.1111/gcb.13776. Epub 2017 Jul 12. Glob Chang Biol. 2017. PMID: 28590592
-
Effects of hydrographic variability on the spatial, seasonal and diel diving patterns of southern elephant seals in the eastern Weddell Sea.PLoS One. 2010 Nov 3;5(11):e13816. doi: 10.1371/journal.pone.0013816. PLoS One. 2010. PMID: 21072199 Free PMC article.
-
Recent climate change in the Arctic and its impact on contaminant pathways and interpretation of temporal trend data.Sci Total Environ. 2005 Apr 15;342(1-3):5-86. doi: 10.1016/j.scitotenv.2004.12.059. Epub 2005 Mar 19. Sci Total Environ. 2005. PMID: 15866268 Review.
Cited by
-
Estimating fine-scale changes in turbulence using the movements of a flapping flier.J R Soc Interface. 2022 Nov;19(196):20220577. doi: 10.1098/rsif.2022.0577. Epub 2022 Nov 9. J R Soc Interface. 2022. PMID: 36349445 Free PMC article.
-
Ocean sentinel albatrosses locate illegal vessels and provide the first estimate of the extent of nondeclared fishing.Proc Natl Acad Sci U S A. 2020 Feb 11;117(6):3006-3014. doi: 10.1073/pnas.1915499117. Epub 2020 Jan 27. Proc Natl Acad Sci U S A. 2020. PMID: 31988130 Free PMC article.
-
Big data analyses reveal patterns and drivers of the movements of southern elephant seals.Sci Rep. 2017 Mar 8;7(1):112. doi: 10.1038/s41598-017-00165-0. Sci Rep. 2017. PMID: 28273915 Free PMC article.
-
Flight paths of seabirds soaring over the ocean surface enable measurement of fine-scale wind speed and direction.Proc Natl Acad Sci U S A. 2016 Aug 9;113(32):9039-44. doi: 10.1073/pnas.1523853113. Epub 2016 Jul 25. Proc Natl Acad Sci U S A. 2016. PMID: 27457932 Free PMC article.
-
A quantitative, hierarchical approach for detecting drift dives and tracking buoyancy changes in southern elephant seals.Sci Rep. 2019 Jun 20;9(1):8936. doi: 10.1038/s41598-019-44970-1. Sci Rep. 2019. PMID: 31222003 Free PMC article.
References
-
- Serreze MC, Holland MM, Stroeve J. Perspectives on the Arctic's shrinking sea-ice cover. Science. 2007;315:1533–1536. - PubMed
-
- Curry R, Mauritzen C. Dilution of the northern North Atlantic Ocean in recent decades. Science. 2005;308:1772–1774. - PubMed
-
- Gille ST. Warming of the Southern Ocean since the 1950s. Science. 2002;295:1275–1277. - PubMed
-
- Aoki S, Rintoul SR, Ushio S, Watanabe S, Bindoff NL. Freshening of the Adélie and Bottom Water near 140°E. Geophys Res Lett. 2005;32:L23601.
-
- Rintoul SR. Rapid freshening of Antarctic bottom water formed in the Indian and Pacific oceans. Geophys Res Lett. 2007;34:L06606.
Publication types
MeSH terms
Substances
LinkOut - more resources
Full Text Sources
Miscellaneous
