. 2008 Jul;35(7):3372-82.
doi: 10.1118/1.2940194.

An improved algorithm for femoropopliteal artery centerline restoration using prior knowledge of shapes and image space data

Affiliations

An improved algorithm for femoropopliteal artery centerline restoration using prior knowledge of shapes and image space data

Tejas Rakshe et al. Med Phys. 2008 Jul.

Abstract

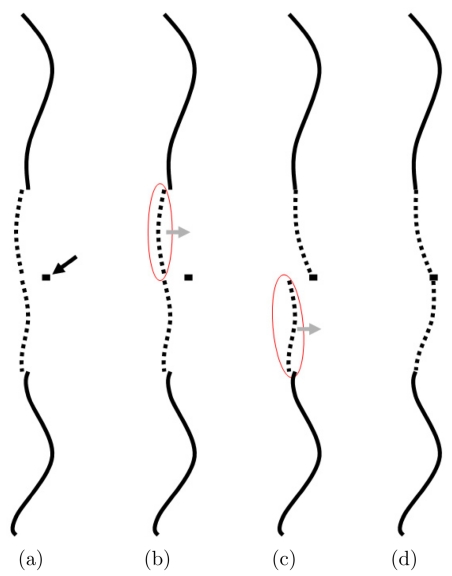
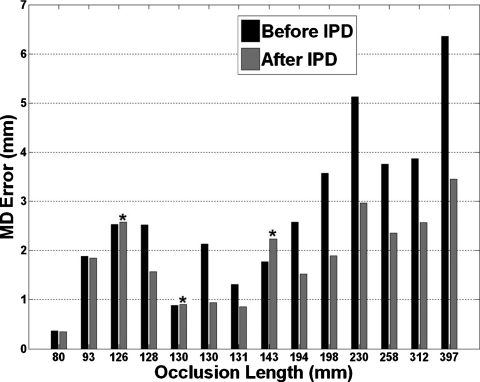
Accurate arterial centerline extraction is essential for comprehensive visualization in CT Angiography. Time consuming manual tracking is needed when automated methods fail to track centerlines through severely diseased and occluded vessels. A previously described algorithm, Partial Vector Space Projection (PVSP), which uses vessel shape information from a database to bridge occlusions of the femoropopliteal artery, has a limited accuracy in long (>100 mm) occlusions. In this article we introduce a new algorithm, Intermediate Point Detection (IPD), which uses calcifications in the occluded artery to provide additional information about the location of the centerline to facilitate improvement in PVSP performance. It identifies calcified plaque in image space to find the most useful point within the occlusion to improve the estimate from PVSP. In this algorithm candidates for calcified plaque are automatically identified on axial CT slices in a restricted region around the estimate obtained from PVSP. A modified Canny edge detector identifies the edge of the calcified plaque and a convex polygon fit is used to find the edge of the calcification bordering the wall of the vessel. The Hough transform for circles estimates the center of the vessel on the slice, which serves as a candidate intermediate point. Each candidate is characterized by two scores based on radius and relative position within the occluded segment, and a polynomial function is constructed to define a net score representing the potential benefit of using this candidate for improving the centerline. We tested our approach in 44 femoropopliteal artery occlusions of lengths up to 398 mm in 30 patients with peripheral arterial occlusive disease. Centerlines were tracked manually by four-experts, twice each, with their mean serving as the reference standard. All occlusions were first interpolated with PVSP using a database of femoropopliteal arterial shapes obtained from a total of 60 subjects. Occlusions longer than 80 mm (N = 20) were then processed with the IPD algorithm, provided calcifications were found (N = 14). We used the maximum point-wise distance of an interpolated curve from the reference standard as our error metric. The IPD algorithm significantly reduced the average error of the initial PVSP from 2.76 to 1.86 mm (p < 0.01). The error was less than the clinically desirable 3 mm (smallest radius of the femoropopliteal artery) in 13 of 14 occlusions. The IPD algorithm achieved results within the range of the human readers in 11 of 14 cases. We conclude that the additional use of sparse but specific image space information, such as calcified atherosclerotic plaque, can be used to substantially improve the performance of a previously described knowledge-based method to restore the centerlines of femoropopliteal arterial occlusions.


Figures

Figure 1
Figure 1
Sketch depicting, in two dimensions, the initial estimate Ep and the double cone-like zone around it as a shaded region. C(i) is the an intermediate point candidate and p(i) is the distance between the midpoint and the point closest to C(i) along Ep.
Figure 2
Figure 2
Various stages of the process of obtaining the intermediate point candidate: (a) An axial slice image through the CTA data shows one leg. The box encloses the calcification of interest. (b) Magnified view of the calcification in the box in (a). (c) The seed, extracted from (b), used by the modified Canny edge detector. (d) The edge of the calcification detected by the modified Canny edge detector. (e) The outer edge, obtained by finding the smallest convex polygon that encloses the entire edge of the calcification. (f) The circle fit and its center, indicated by the arrow, obtained by the Hough transform for circles. (g) The circle and its center (intermediate point candidate) superimposed on the calcification.
Figure 3
Figure 3
Schematic shows how an intermediate point effectively turns one long occlusion into two smaller occlusions, and hence reduces the error of the estimate. (a) The PVSP estimate using the additional intermediate point information is shown, prior to the end point correction, as the dotted line and the solid black arrow point to the intermediate point. (b) The estimated segment proximal to the intermediate point is identified and a linear correction is applied to it. (c) The estimated segment distal to the intermediate point is identified and a separate linear correction is applied to it. (d) The final estimate passes through the intermediate point.
Figure 4
Figure 4
The box plot of weights w1 through w5. The box shows the interquartile range with the median, the whiskers show the range of the data, and + marks show outliers. An outlier is defined as a value more than 1.5 times the interquartile range away from the top or the bottom of the box.
Figure 5
Figure 5
MD error before and after the IPD algorithm was applied. The asterisk symbol marks cases where IPD increased the error.
Figure 6
Figure 6
MD error for each of the 14 occlusions for the estimates found by the IPD algorithm along with the worst manual reading. In three occlusions (lengths 126, 230, and 397 mm) the IPD error is more than 1 mm higher than the worst manual error.
Figure 7
Figure 7
(a) Performance of only the PVSP method, without using IPD. The dotted line shows linear regression with slope 0.015, y-intercept −0.161, and R2=0.865. (b) Performance of the overall method with the IPD algorithm. The dotted line shows linear regression with slope 0.009, y-intercept 0.138, and R2=0.792.
Figure 8
Figure 8
Centerline restoration of a long femoropopliteal artery occlusion using Partial Vector Space Projection (PVSP) alone, and augmented by Intermediate Point Detection (IPD) versus the reference standard. (a) Maximum Intensity projection (MIP) shows a long (397 mm) right femoropopliteal artery occlusion (asterisks), and three centerlines obtained with PVSP, IPD, and the reference standard. Arrows in (a) correspond to transverse images shown in (b), (c), and (d): Open arrow level of greatest MD error for IPD; Plain arrow level of arterial calcification detected and selected by IPD; Arrowhead level of greatest MD error for PVSP. Circles in (b–d) indicate area around the occluded artery. Dots correspond to the interpolated (PVSP and IPD) and reference standard centerlines. Panels (e), (f), and (g) are curved planar reformats (CPR) through the centerlines obtained with (e) PVSP, (f) IPD, and (g) the reference standard, generated at a left anterior oblique viewing angles of 73°. Centerlines are shown, and asterisks indicate start and end of the occlusion. Note that the initial centerline estimate obtained with the PVSP algorithm (dots in b–d) is mostly located outside of the occluded artery, which is best seen at the level of the arterial calcification in (c) and at the level of the greatest MD error observed with the PVSP (d). The corresponding CPR image shows the path anteromedially of the occluded artery [plain arrow and arrow head in (e)]. More proximally [open arrow in (e)] the CPR image is constructed anterolaterally of the occluded artery, which is therefore not displayed at this level. After applying the IPD algorithm, a new intermediate point [a dot in (c)] is used at the level of the ring-like calcification shown at this level, resulting in correction of the centerline through most of the occluded artery (f), with the exception of its proximal portion, where the centerline is estimated just at the margin of the femoropopliteal artery [a dot in (b), and open arrow in (f)]. CPR through the reference standard centerline is within the occluded vessel at all levels (g).

References

    1. Zarins C. K., Xu C., and Glagov S., “Artery wall pathology in atherosclerosis,” in: Vascular Surgery, 6th ed.(Saunders, Philadelphia, 2005), pp. 123–148.
    1. Roos J. E., Köechl A., Rakshe T., Straka M., Napoli A., Kanitsar A., Šrámek M., Gröller E., and Fleischmann D., “Multi-path curved planar reformation (mpCPR) of the peripheral arterial tree in CT angiography (CTA),” Radiology RADLAX 244, 281–290 (2007). - PubMed
    1. Rakshe T., Fleischmann D., Rosenberg J., Roos J. E., and Napel S., “Knowledge-based interpolation of curves: Application to femoropopliteal arterial centerline restoration,” Med. Image Anal. MIAECY 11, 157–168 (2007). - PMC - PubMed
    1. Kanitsar A., Wegenkittl R., Felkel P., Fleischmann D., Sandner D., and Gröeller E., “Computed tomography angiography: A case study of peripheral vessel investigation,” Proceedings of IEEE Visualization 2001, San Diego, California, pp. 477–480.
    1. Cohen L. D. and Deschamps T., “Grouping connected components using minimal path techniques: Application to reconstruction of vessels in 2D and 3D images,” IEEE Computer Society Conference on Computer Vision and Pattern Recognition (CVPR’01), 2001, pp. 102–109.

Publication types

LinkOut - more resources