. 2008 Nov 15;17(22):3487-501.
doi: 10.1093/hmg/ddn241. Epub 2008 Aug 12.

The ocular albinism type 1 protein, an intracellular G protein-coupled receptor, regulates melanosome transport in pigment cells

Affiliations

The ocular albinism type 1 protein, an intracellular G protein-coupled receptor, regulates melanosome transport in pigment cells

Ilaria Palmisano et al. Hum Mol Genet. .

Erratum in

Abstract

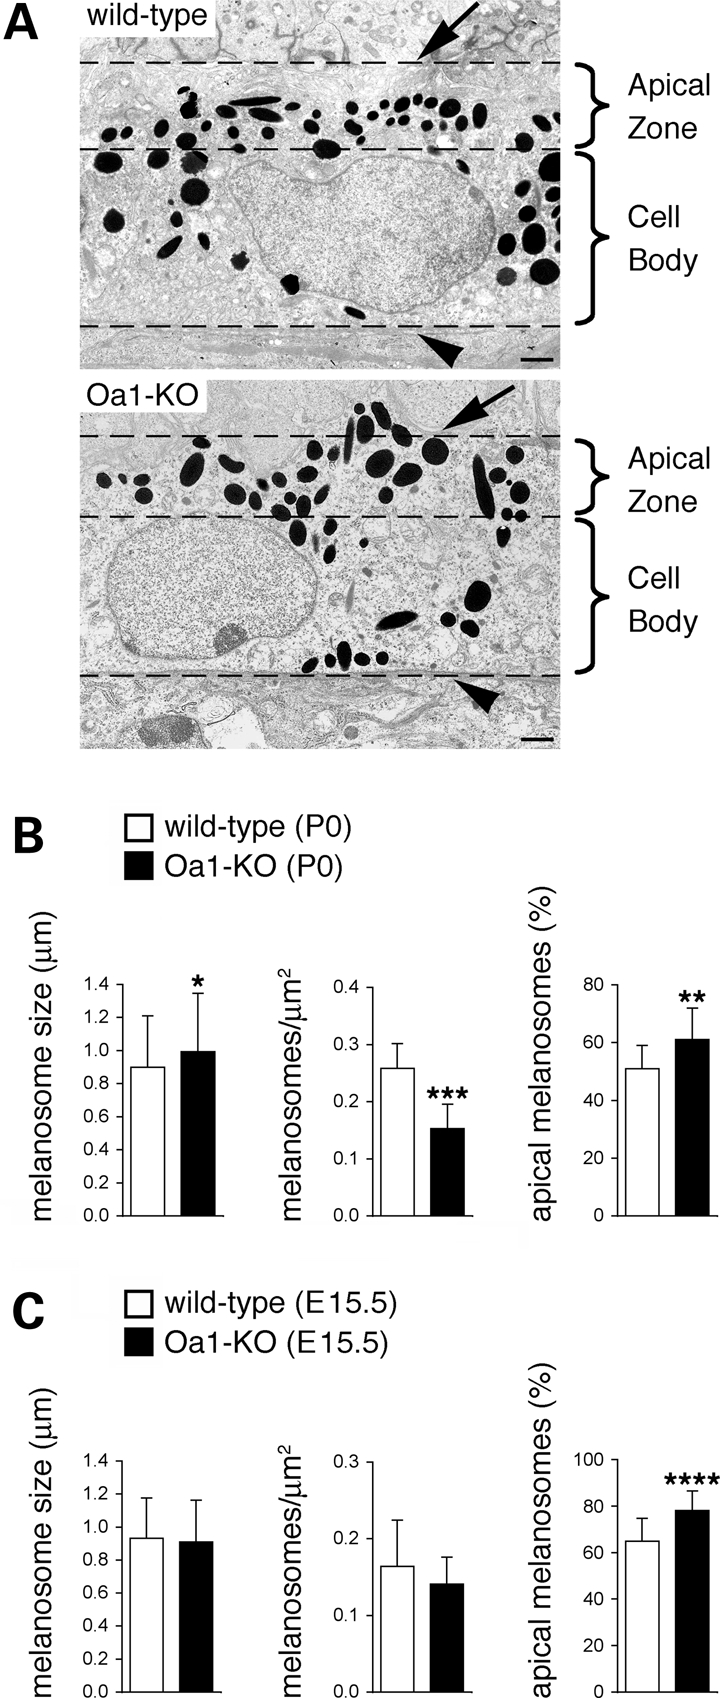
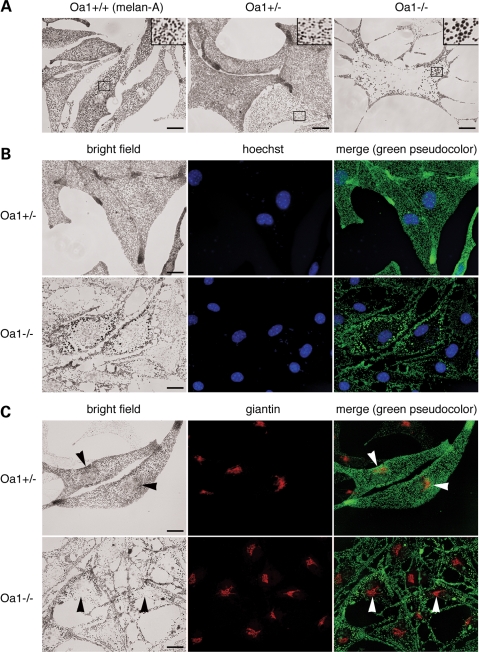
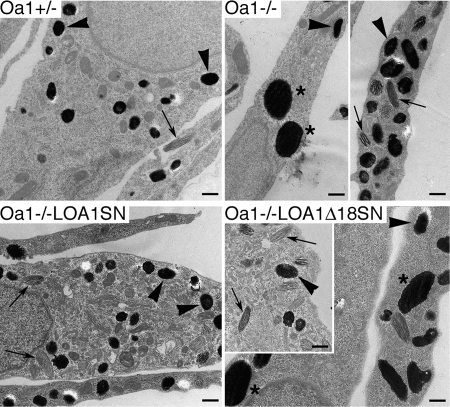
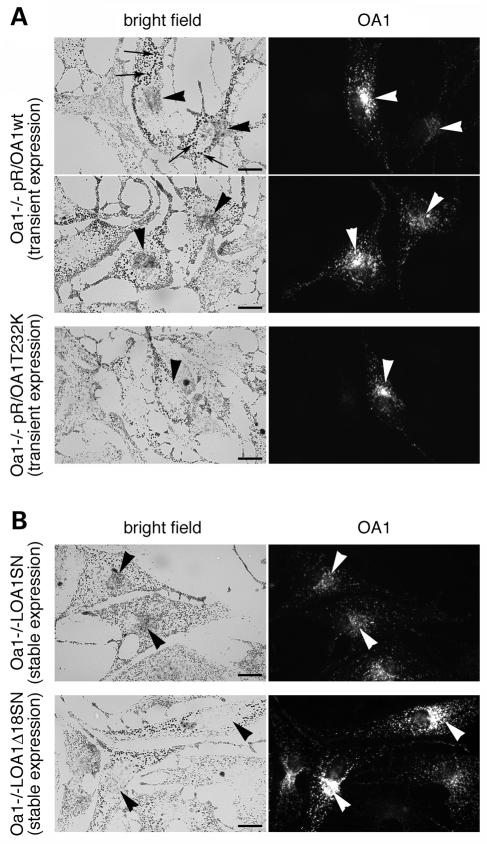
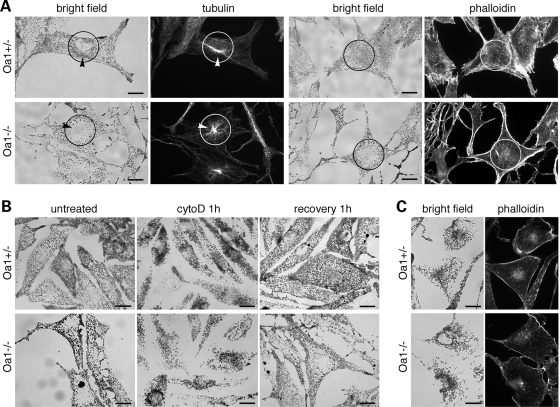
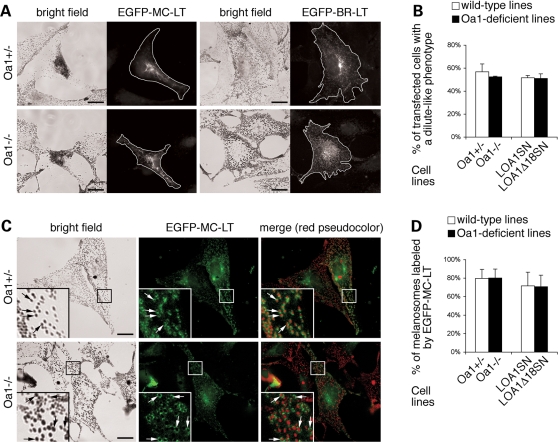
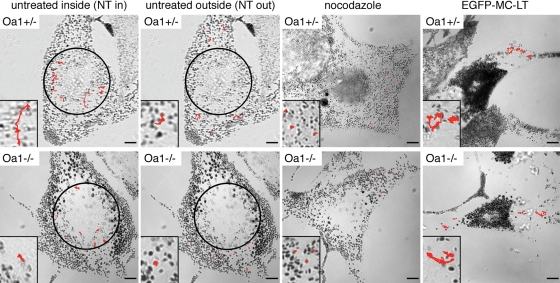
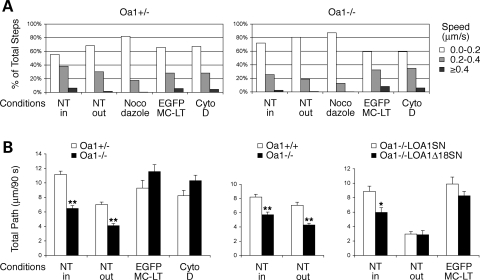
The protein product of the ocular albinism type 1 gene, named OA1, is a pigment cell-specific G protein-coupled receptor exclusively localized to intracellular organelles, namely lysosomes and melanosomes. Loss of OA1 function leads to the formation of macromelanosomes, suggesting that this receptor is implicated in organelle biogenesis, however the mechanism involved in the pathogenesis of the disease remains obscure. We report here the identification of an unexpected abnormality in melanosome distribution both in retinal pigment epithelium (RPE) and skin melanocytes of Oa1-knock-out (KO) mice, consisting in a displacement of the organelles from the central cytoplasm towards the cell periphery. Despite their depletion from the microtubule (MT)-enriched perinuclear region, Oa1-KO melanosomes were able to aggregate at the centrosome upon disruption of the actin cytoskeleton or expression of a dominant-negative construct of myosin Va. Consistently, quantification of organelle transport in living cells revealed that Oa1-KO melanosomes displayed a severe reduction in MT-based motility; however, this defect was rescued to normal following inhibition of actin-dependent capture at the cell periphery. Together, these data point to a defective regulation of organelle transport in the absence of OA1 and imply that the cytoskeleton might represent a downstream effector of this receptor. Furthermore, our results enlighten a novel function for OA1 in pigment cells and suggest that ocular albinism type 1 might result from a different pathogenetic mechanism than previously thought, based on an organelle-autonomous signalling pathway implicated in the regulation of both membrane traffic and transport.


Figures

Figure 1.
Figure 1.
Melanosomes are more concentrated towards the apical surface in Oa1-KO RPE. (A) Micrographs of RPE cells from wild-type and Oa1-KO mice at P0. At this stage, RPE apical processes (and photoreceptor outer segments) are not developed yet and therefore could not be evaluated. Dashed lines indicate the boundaries of apical and basolateral regions of RPE cells as defined to quantify melanosome distribution (see below and Materials and Methods). In Oa1-KO RPE, a greater fraction of melanosomes appears located in the apical region (this is particularly evident in areas devoid of nuclei). Arrows, apical membrane; arrowheads, basal membrane. Bars, 1 µm. (B and C) Quantification of melanosome size, density and distribution in wild-type and Oa1-KO RPE at P0 (B), and E15.5 (C). Melanosome size histograms represent the mean ± SD of the major organelle diameter measured for 120–140 (B) or 215–230 (C) melanosomes belonging to different sections and with an apparent size ≥0.5 µm. Melanosome density histograms represent the mean ± SD of the number of organelles per μm2 obtained from 7–8 (B) or 23–25 (C) independent RPE sections. Melanosome distribution histograms represent the mean ± SD of the percent of organelles located in the apical area (apical third of the selected area, see Materials and Methods) over the total number of organelles in 20–25 independent RPE sections. Total number of melanosomes counted to determine melanosome distribution: wild-type =1132 (B) and 753 (C); Oa1-KO = 891 (B) and 575 (C). *P < 0.02, **P < 0.002, ***P < 0.001, ****P < 0.00001 (unpaired Student's t-test assuming equal variances). At both stages, including E15.5, when the organelles are not enlarged nor significantly reduced in number yet, melanosomes are more abundant towards the apical region of RPE cells in Oa1-KO compared with wild-type mice.
Figure 2.
Figure 2.
Melanosomes are displaced towards the cell periphery in Oa1-KO melanocytes. (A) Representative bright field optical pictures of the indicated melanocyte cell lines, in which melanosomes, thanks to the melanin pigment, represent the only visible dark objects. In addition to the presence of larger melanosomes (see inset for 3× magnification), Oa1−/− melanocytes show exclusion of the pigmented organelles from the perinuclear region and their concentration at the cell periphery. (B) Melanosomes are colocalized with the cell nuclei, visualized by Hoechst staining. The merge shows poor overlap between melanosomes and the cell nuclei in Oa1−/− cells. (C) Melanosomes are colocalized with the Golgi apparatus, visualized by anti-giantin antibodies. Arrowheads in bright field pictures and merge point to the melanosomal enrichment in the Golgi area in Oa1+/−, but not Oa1−/−, melanocytes. Bars, 15 µm.
Figure 3.
Figure 3.
Both normal and giant melanosomes are found in Oa1-deficient melanocytes. Ultrastructural analysis of the indicated cell lines, in which mature fully pigmented melanosomes appear as black organelles due to melanin electron density and display either elliptical or spherical shapes depending on the section. Oa1−/−LOA1SN and Oa1−/−LOA1Δ18SN, cell lines derived from transduction of Oa1−/− melanocytes with retroviral vectors carrying the wild-type or mutant OA1, respectively. Similarly to wild-type, Oa1−/− and Oa1−/−LOA1Δ18SN melanocytes show immature (arrows) and mature (arrowheads) melanosomes of normal size. However, differently from wild-type, these cells also show the presence of macromelanosomes (asterisks). Bars, 1 µm.
Figure 4.
Figure 4.
Expression of the OA1 cDNA rescues the Oa1-KO phenotype. Oa1−/− melanocytes were transfected with a plasmid vector (A) or infected with a retroviral vector (B) expressing either wild-type (pR/OA1wt and LOA1SN) or mutant (pR/OA1T232K or LOA1Δ18SN; both these mutants display a subcellular distribution indistinguishable from wild-type) human OA1. Expression of the recombinant proteins was analyzed 24 h after transfection (A), or following G418 selection through several passages (B), by indirect immunofluorescence with antibodies specific to human OA1. Transient expression of wild-type OA1 is not sufficient to eliminate the giant melanosomes (A, pR/OA1wt; arrows), which disappear only upon stable transduction (B, LOA1SN). Redistribution of melanosomes towards the perinuclear/Golgi area, where OA1 is also normally enriched, is induced by wild-type OA1 both in transiently and stably transduced Oa1−/− cells (A, pR/OA1wt, and B, LOA1SN; arrowheads). No correction of melanosomal size or distribution was observed with mutant OA1 at any time (A, pR/OA1T232K, and B, LOA1Δ18SN; arrowheads). Bars, 15 µm.
Figure 5.
Figure 5.
Melanosomes redistribute according to MT density towards the nucleus upon disruption of the actin network in wild-type and Oa1-KO melanocytes. (A) Melanosome distribution and cytoskeletal organization. Pictures show the typical distribution of melanosomes, visualized in bright field, compared with tubulin or actin filaments, visualized by indirect immunofluorescence with anti-tubulin antibodies or phalloidin staining, respectively, in Oa1+/− and Oa1−/− cells. Black/white circles indicate the perinuclear area, as defined in organelle tracking analyses (see Materials and Methods), which is typically enriched in MTs (and melanosomes in wild-type, but not mutant, cells), while AF are more abundant at the cell periphery. Arrowheads point to the position of the centrosome. In Oa1−/− melanocytes, despite a similar cytoskeletal organization, melanosomes appear excluded from the MT-enriched perinuclear region. (B) Melanosome redistribution upon disruption of the actin cytoskeleton. Shown are representative bright field pictures of Oa1+/− and Oa1−/− cells prior to treatment (untreated); after 1 h of cytochalasin D treatment (cyto D 1 h); and, following removal of the drug and extensive washing, allowed to recover for 1 h (recovery 1 h). In both cell types, melanosome similarly redistribute upon AF disruption and recover to the original distribution after withdrawal of the drug. (C) Melanosome redistribution after 1 h of cytochalasin D treatment is compared with the residual AF labelling by phalloidin under the plasma membrane, confirming the absence of generalized retraction of cell margins. Bars, 15 µm.
Figure 6.
Figure 6.
Melanosomes aggregate to the central cytoplasm upon disruption of myosin Va function and efficiently recruit its tail domain in wild-type and Oa1-KO melanocytes. (A) Representative optical pictures showing the redistribution of melanosomes upon expression of a dominant-negative construct for myosin Va. Oa1+/− and Oa1−/− cells were transfected with pEGFP-MC-LT, driving the expression of the EGFP-tagged melanocyte-specific tail domain of myosin Va. The pEGFP-BR-LT plasmid, driving the expression of the brain-specific tail domain of myosin Va, was used as negative control. After 24–72 h, the distribution of melanosomes in bright field was assessed in EGFP-positive cells. The white line marks the edges of transfected cells. Bars, 15 µm. (B) Quantification of melanosome aggregation in parental and transduced pEGFP-MC-LT transfected cells. Results represent the mean ± SD of 2-3 independent experiments (total number of cells counted for each line: 80–250). The dilute-like phenotype was observed in a similarly high percent of transfected wild-type and Oa1-deficient melanocytes. (C) Representative optical pictures showing the colocalization of melanosomes with the melanocyte-specific tail domain of myosin Va. Oa1+/− and Oa1−/− cells were transfected with pEGFP-MC-LT and analyzed before the appearance of a complete dilute-like phenotype. Melanosomes are typically surrounded by a ring of fluorescence corresponding to the EGFP-MC-LT construct in both wild-type and Oa1-KO cells. In the insets (4× magnification), arrows point to examples of colocalization. Bars, 15 µm. (D) Quantification of melanosome colocalization with the EGFP-MC-LT fusion protein in parental and transduced transfected cells. Results represent the mean ± SD of the data obtained from 10 different cells pooled from 2–3 independent experiments (total number of melanosomes counted for each cell line: 250–300). No significant differences were found between wild-type and Oa1-deficient melanocytes.
Figure 7.
Figure 7.
Melanosomes display defective motility in Oa1-KO melanocytes. Representative examples of melanosome paths covered during the 90 s time frame in Oa1+/− and Oa1−/− cells, either in untreated conditions (NT), or after nocodazole treatment, or following expression of the dominant-negative myosin Va construct (EGFP-MC-LT). In untreated cells, melanosomes were analysed either within (NT in), or outside (NT out) of the perinuclear area, which is delimited by the black 15 µm-radius circle in the pictures. In the insets (2.5× magnification) representative trajectories are shown in red. The longest paths occur in untreated Oa1+/− cells (particularly in the perinuclear area) and in pEGFP-MC-LT-transfected Oa1+/− and Oa1−/− cells, while melanosomes appear mostly stationary in untreated Oa1−/− cells and in both cell types upon nocodazole treatment. Bars, 5 µm.
Figure 8.
Figure 8.
Quantification of melanosome motility in wild-type and Oa1-KO melanocytes. (A) Speed distribution profile obtained by pooling and binning in increasing speed intervals, as indicated, all melanosome steps from Oa1+/− melanocytes, or from Oa1−/− melanocytes. Cells were analyzed either untreated and selected inside or outside of the perinuclear area (NT in and out, respectively); or after treatment with nocodazole to deplete the MTs; or following expression of the dominant-negative myosin Va construct (EGFP-MC-LT), or treatment with cytochalasin D (Cyto D) to disrupt AF-based transport. Number of melanosomes tracked: NT in = 103, NT out = 100, nocodazole = 90, EGFP-MC-LT and Cyto D = 50 (obtained from several different cells: 10–12 for NT and nocodazole; 5–7 for EGFP-MC-LT and Cyto D). Data are expressed as percent of total steps. In both melanocyte lines, speeds ≥0.4 μm/s (dark grey) are totally abolished by nocodazole, indicating that they represent a pure MT-dependent component. Oa1−/− melanocytes show a decreased motility in untreated conditions, yet recover completely upon disruption of AF-based transport. (B) Average total path of melanosomes from the same tracking analysis described above for Oa1+/− versus Oa1−/− melanocytes, and from similar analyses performed in Oa1+/+ versus Oa1−/− melanocytes, and in transduced Oa1−/−LOA1SN versus Oa1−/−LOA1Δ18SN lines. For each wild-type and Oa1-deficient lines compared in the graphs, tracked melanosomes were of comparable size (see Supplementary Material, Table S1). Results represent the mean ± SEM of the data from 40–100 melanosomes (considering one melanosome path as one data point). Compared with their wild-type counterpart, Oa1-deficient melanocytes show a significantly reduced average displacement in untreated conditions, while they completely recover upon pEGFP-MC-LT transfection, or cytochalasin D treatment. Transduced lines showed poor motility at the cell periphery (possibly due to the drug treatment necessary for maintenance of the transgenes), so differences were only appreciable in the perinuclear area. *P < 0.004, **P < 0.00001 (unpaired Student's t-test assuming equal variances).

Similar articles

Cited by

References

    1. Quevedo W.C., Fitzpatrick T.B., Szabo G., Jimbow K. Biology of melanocytes. In: Fitzpatrick T.B., Eisen A.Z., Wolff K., Freedberg I.M., Austen K.F., editors. Dermatology in General Medicine. Vol. 1. New York: McGraw-Hill; 1987. pp. 224–251.
    1. Orlow S.J. Melanosomes are specialized members of the lysosomal lineage of organelles. J. Invest. Dermatol. 1995;105:3–7. - PubMed
    1. Dell'Angelica E.C., Mullins C., Caplan S., Bonifacino J.S. Lysosome-related organelles. FASEB J. 2000;14:1265–1278. - PubMed
    1. Raposo G., Marks M.S. The dark side of lysosome-related organelles: specialization of the endocytic pathway for melanosome biogenesis. Traffic. 2002;3:237–248. - PubMed
    1. Raposo G., Tenza D., Murphy D.M., Berson J.F., Marks M.S. Distinct protein sorting and localization to premelanosomes, melanosomes, and lysosomes in pigmented melanocytic cells. J. Cell Biol. 2001;152:809–824. - PMC - PubMed

Publication types

MeSH terms