

Glucocorticoid receptor haploinsufficiency causes hypertension and attenuates hypothalamic-pituitary-adrenal axis and blood pressure adaptions to high-fat diet
- PMID: 18697839
- PMCID: PMC2749453
- DOI: 10.1096/fj.08-111914
Glucocorticoid receptor haploinsufficiency causes hypertension and attenuates hypothalamic-pituitary-adrenal axis and blood pressure adaptions to high-fat diet
Abstract
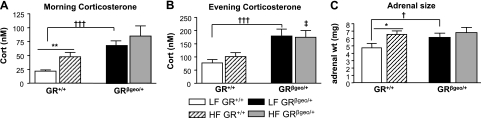
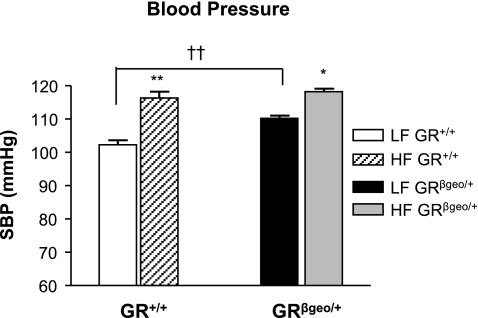
Glucocorticoid hormones are critical to respond and adapt to stress. Genetic variations in the glucocorticoid receptor (GR) gene alter hypothalamic-pituitary-adrenal (HPA) axis activity and associate with hypertension and susceptibility to metabolic disease. Here we test the hypothesis that reduced GR density alters blood pressure and glucose and lipid homeostasis and limits adaption to obesogenic diet. Heterozygous GR(betageo/+) mice were generated from embryonic stem (ES) cells with a gene trap integration of a beta-galactosidase-neomycin phosphotransferase (betageo) cassette into the GR gene creating a transcriptionally inactive GR fusion protein. Although GR(betageo/+) mice have 50% less functional GR, they have normal lipid and glucose homeostasis due to compensatory HPA axis activation but are hypertensive due to activation of the renin-angiotensin-aldosterone system (RAAS). When challenged with a high-fat diet, weight gain, adiposity, and glucose intolerance were similarly increased in control and GR(betageo/+) mice, suggesting preserved control of intermediary metabolism and energy balance. However, whereas a high-fat diet caused HPA activation and increased blood pressure in control mice, these adaptions were attenuated or abolished in GR(betageo/+) mice. Thus, reduced GR density balanced by HPA activation leaves glucocorticoid functions unaffected but mineralocorticoid functions increased, causing hypertension. Importantly, reduced GR limits HPA and blood pressure adaptions to obesogenic diet.
Figures


Similar articles
-
Mineralocorticoid and glucocorticoid receptor balance in control of HPA axis and behaviour.Psychoneuroendocrinology. 2013 May;38(5):648-58. doi: 10.1016/j.psyneuen.2012.08.007. Epub 2012 Sep 11. Psychoneuroendocrinology. 2013. PMID: 22980941
-
The effects of high fat diet on the basal activity of the hypothalamus-pituitary-adrenal axis in mice.J Endocrinol. 2012 Aug;214(2):191-7. doi: 10.1530/JOE-12-0056. Epub 2012 May 22. J Endocrinol. 2012. PMID: 22619233
-
Disrupting hypothalamic glucocorticoid receptors causes HPA axis hyperactivity and excess adiposity.Mol Endocrinol. 2013 Oct;27(10):1655-65. doi: 10.1210/me.2013-1187. Epub 2013 Aug 26. Mol Endocrinol. 2013. PMID: 23979842 Free PMC article.
-
Effects of genetically altered brain glucocorticoid receptor action on behavior and adrenal axis regulation in mice.Front Neuroendocrinol. 2006 Sep;27(3):275-84. doi: 10.1016/j.yfrne.2006.05.001. Epub 2006 Jun 30. Front Neuroendocrinol. 2006. PMID: 16814372 Review.
-
Dissection of glucocorticoid receptor-mediated inhibition of the hypothalamic-pituitary-adrenal axis by gene targeting in mice.Front Neuroendocrinol. 2015 Jan;36:150-64. doi: 10.1016/j.yfrne.2014.09.002. Epub 2014 Sep 27. Front Neuroendocrinol. 2015. PMID: 25256348 Free PMC article. Review.
Cited by
-
Glucocorticoid receptor alters isovolumetric contraction and restrains cardiac fibrosis.J Endocrinol. 2017 Mar;232(3):437-450. doi: 10.1530/JOE-16-0458. Epub 2017 Jan 5. J Endocrinol. 2017. PMID: 28057868 Free PMC article.
-
Lung epithelial tip progenitors integrate glucocorticoid- and STAT3-mediated signals to control progeny fate.Development. 2016 Oct 15;143(20):3686-3699. doi: 10.1242/dev.134023. Epub 2016 Aug 30. Development. 2016. PMID: 27578791 Free PMC article.
-
The Potential of ACTH in the Genesis of Primary Aldosteronism.Front Endocrinol (Lausanne). 2016 May 23;7:40. doi: 10.3389/fendo.2016.00040. eCollection 2016. Front Endocrinol (Lausanne). 2016. PMID: 27242664 Free PMC article.
-
Salt-Sensitive Hypertension in GR+/- Rats Is Accompanied with Dysregulation in Adrenal Soluble Epoxide Hydrolase and Polyunsaturated Fatty Acid Pathways.Int J Mol Sci. 2021 Dec 8;22(24):13218. doi: 10.3390/ijms222413218. Int J Mol Sci. 2021. PMID: 34948014 Free PMC article.
-
Crosstalk of hepatocyte nuclear factor 4a and glucocorticoid receptor in the regulation of lipid metabolism in mice fed a high-fat-high-sugar diet.Lipids Health Dis. 2022 May 25;21(1):46. doi: 10.1186/s12944-022-01654-6. Lipids Health Dis. 2022. PMID: 35614477 Free PMC article.
References
-
- Whitworth J A, Brown M A, Kelly J J, Williamson P M. Mechanisms of cortisol-induced hypertension in humans. Steroids. 1995;60:76–80. - PubMed
-
- Dallman M F, Strack A M, Akana S F, Bradbury M J, Hanson E S, Scribner K A, Smith M. Feast and famine–critical role of glucocorticoids with insulin in daily energy-flow. Front Neuroendocrinol. 1993;14:303–347. - PubMed
-
- Ballard P L, Baxter J D, Higgins S J, Rousseau G G, Tomkins G M. General presence of glucocorticoid receptors in mammalian tissues. Endocrinology. 1974;94:998–1002. - PubMed
-
- Miesfeld R, Rusconi S, Godowski P J, Maler B A, Okret S, Wikström A C, Gustafsson J-Å, Yamamoto K R. Genetic complementation of a glucocorticoid receptor deficiency by expression of cloned receptor cdna. Cell. 1986;46:389–399. - PubMed
Publication types
MeSH terms
Substances
Grants and funding
LinkOut - more resources
Full Text Sources
Medical
Molecular Biology Databases
