. 2008 Nov 25;105(47):18120-5.
doi: 10.1073/pnas.0801066105. Epub 2008 Aug 12.

Desorption electrospray ionization mass spectrometry: Imaging drugs and metabolites in tissues

Affiliations

Desorption electrospray ionization mass spectrometry: Imaging drugs and metabolites in tissues

Justin M Wiseman et al. Proc Natl Acad Sci U S A. .

Erratum in

  • Proc Natl Acad Sci U S A. 2009 Apr 7;106(14):6022

Abstract

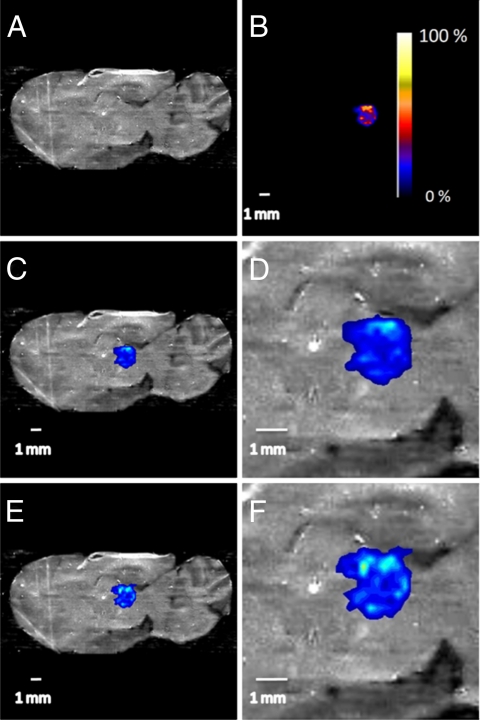
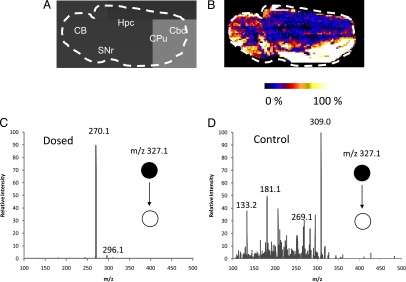
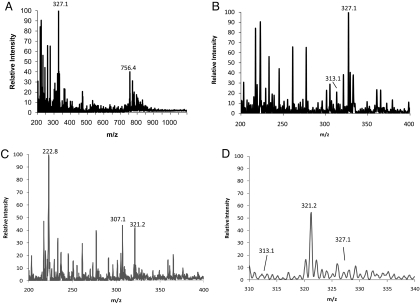
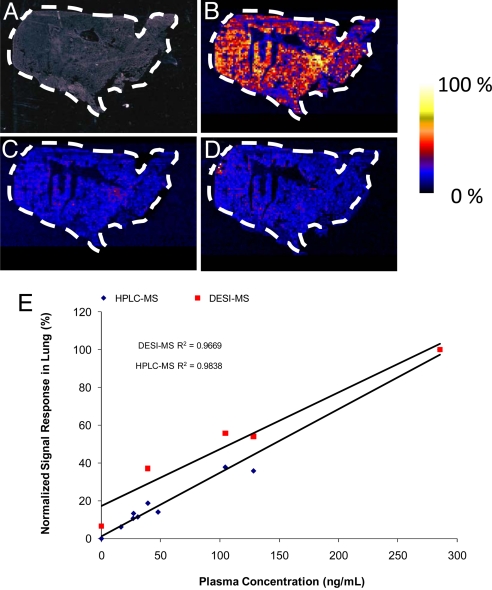
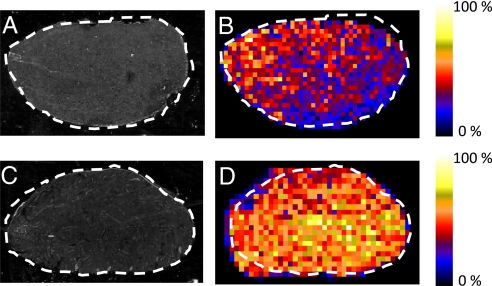
Ambient ionization methods for MS enable direct, high-throughput measurements of samples in the open air. Here, we report on one such method, desorption electrospray ionization (DESI), which is coupled to a linear ion trap mass spectrometer and used to record the spatial intensity distribution of a drug directly from histological sections of brain, lung, kidney, and testis without prior chemical treatment. DESI imaging provided identification and distribution of clozapine after an oral dose of 50 mg/kg by: i) measuring the abundance of the intact ion at m/z 327.1, and ii) monitoring the dissociation of the protonated drug compound at m/z 327.1 to its dominant product ion at m/z 270.1. In lung tissues, DESI imaging was performed in the full-scan mode over an m/z range of 200-1100, providing an opportunity for relative quantitation by using an endogenous lipid to normalize the signal response of clozapine. The presence of clozapine was detected in all tissue types, whereas the presence of the N-desmethyl metabolite was detected only in the lung sections. Quantitation of clozapine from the brain, lung, kidney, and testis, by using LC-MS/MS, revealed concentrations ranging from 0.05 microg/g (brain) to a high of 10.6 microg/g (lung). Comparisons of the results recorded by DESI with those by LC-MS/MS show good agreement and are favorable for the use of DESI imaging in drug and metabolite detection directly from biological tissues.


Conflict of interest statement

Conflict of interest statement: J.M.W. and P.T.K. are employed by Prosolia Inc, a manufacturer of DESI ion sources.

Figures

Fig. 1.
Fig. 1.
Optical images of a sagittal rat brain section and overlayed images of clozapine deposited onto the tissue. (A) Optical image. (B) Interpolated image of an 1 μl deposit of 20 ng/μl solution of clozapine in acetonitrile; pixel size 245 μm × 245 μm; shown with intensity scale bar. (C) Overlay of the optical image in A and the clozapine image in B, shown on the same scale. (D) Zoom (×3) of the overlayed images with 1-mm scale bar. (E) Overlay of the optical image in A and the clozapine image after a second scan. (F) Zoom (×3) of the overlayed images with 1 mm scale bar.
Fig. 2.
Fig. 2.
Optical image of a 22 × 11 mm2 sagittal rat brain section and the corresponding selected ion image. (A) Optical image of a sagittal rat brain section taken from animal 992 (0.5 h after dose). CB, cerebellum; Cbc, cerebral cortex; Cpu, caudate-putamen; Hpc, hippocampus; SNr, substantia nigra. (B) DESI mass spectral image of clozapine in the brain section recorded in MS/MS mode. The image of the fragment ion at m/z 270.1 is shown by using false colors in raw pixel format. (C) Average product ion mass spectrum of m/z 327.1 ± 2 in B. (D) Average product ion mass spectrum of m/z 327.1 ± 2 in control sample 984.
Fig. 3.
Fig. 3.
Average mass spectra recorded in the positive ion mode of a lung tissue section. (A) Full mass spectrum covering the m/z range of 200-1100. (B) Full mass spectrum covering a m/z range of 200–400, showing the protonated clozapine ion (M+H)+ at m/z 327.1 and the protonated desmethyclozapine (DMC) ion (M+H)+ at m/z 313.1. (C) Full mass spectrum of control sample 984 covering the m/z range of 200–400. (D) Shown is the m/z range of 310–340, displaying the absence of clozapine and desmethylclozapine in the control.
Fig. 4.
Fig. 4.
Optical image of a 30.6 × 16.1 mm2 lung tissue section and the corresponding selected ion images, each having 132 × 70 pixels and shown in false colors in raw pixel format. (A) Optical image. (B) Image of clozapine at m/z 327.1. (C) Image of desmethylclozapine at m/z 313.1. (D) Image of sodiated (M+ Na+) PC 16:0/16:0 at m/z 756.4. (E) DESI-MS imaging and LC-MS/MS results of D. The signal responses in each method were normalized to the maximum response in each experiment. The normalized signal responses were then plotted against the clozapine plasma concentrations as determined by LC-MS/MS (Table 1).
Fig. 5.
Fig. 5.
Rat kidney and testis 0.5 h after dose. (A) Optical image of 10 μm rat testis section. (B) Corresponding DESI-MS/MS mass spectral image of clozapine for (A), represented by plotting the intensity of the characteristic fragment ion at m/z 270.1 arising from the mass-selected molecular ion at m/z 327.1 and shown in false colors in raw pixel format. (C) Optical image of 10-μm rat kidney section. (D) Corresponding DESI-MS/MS mass spectral image of clozapine for C, represented by plotting the characteristic fragment ion at m/z 270.1, arising from the mass-selected molecular ion at m/z 327.1 and shown in false colors in raw pixel format.

Similar articles

Cited by

References

    1. Korfmacher WA. In: Using Mass Spectrometry for Drug Metabolism Studies. Korfmacher WA, editor. Boca Raton, FL: CRC Press; 2005. pp. 1–34.
    1. Eckelman WC. Positron Emission Tomography. Godalming, Germany: Springer; 2003. p. 815.
    1. Beckmann N, Laurent D, Tigani B, Panizzutti R, Rudin M. Magnetic resonance imaging in drug discovery: Lessons from disease areas. Drug Discovery Today. 2004;9:35. - PubMed
    1. Solon EG, Balani SK, Lee FW. Whole-body autoradiography in drug discovery. Curr Drug Metab. 2002;3:451. - PubMed
    1. McDonnell LA, Heeren RMA. Imaging mass spectrometry. Mass Spectrom Rev. 2007;26:606–643. - PubMed

Publication types

MeSH terms

LinkOut - more resources