. 2008 Aug 26;105(34):12154-8.
doi: 10.1073/pnas.0803627105. Epub 2008 Aug 12.

Ice cores record significant 1940s Antarctic warmth related to tropical climate variability

Affiliations

Ice cores record significant 1940s Antarctic warmth related to tropical climate variability

David P Schneider et al. Proc Natl Acad Sci U S A. .

Abstract

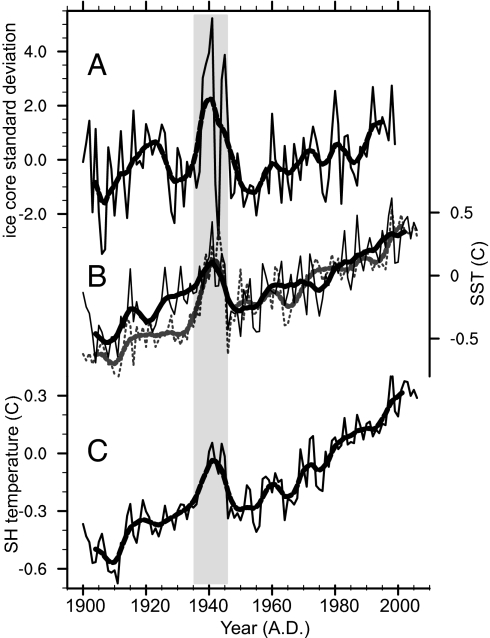
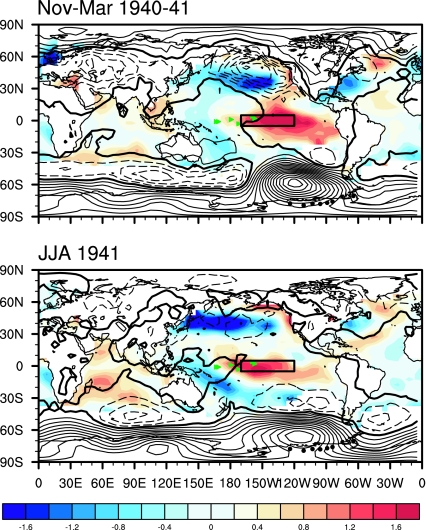
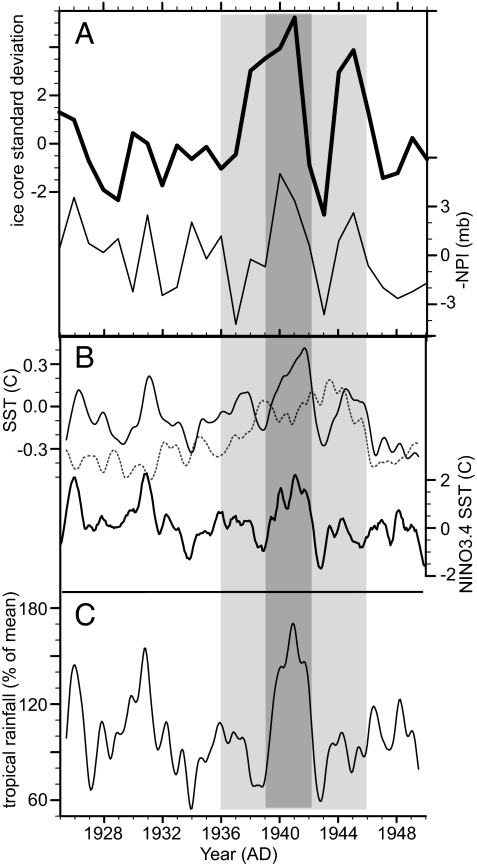
Although the 20th Century warming of global climate is well known, climate change in the high-latitude Southern Hemisphere (SH), especially in the first half of the century, remains poorly documented. We present a composite of water stable isotope data from high-resolution ice cores from the West Antarctic Ice Sheet. This record, representative of West Antarctic surface temperature, shows extreme positive anomalies in the 1936-45 decade that are significant in the context of the background 20th Century warming trend. We interpret these anomalies--previously undocumented in the high-latitude SH--as indicative of strong teleconnections in part driven by the major 1939-42 El Niño. These anomalies are coherent with tropical sea-surface temperature, mean SH air temperature, and North Pacific sea-level pressure, underscoring the sensitivity of West Antarctica's climate, and potentially its ice sheet, to large-scale changes in the global climate.


Conflict of interest statement

The authors declare no conflict of interest.

Figures

Fig. 1.
Fig. 1.
The West Antarctic ice core composite record compared with SST and hemispheric mean surface air temperature for 1900–1999. (A) Time series of the annual mean and 5-year smoothed standardized ice core composite compared with B, observed JJA SST records for 20S-20N (dark solid lines) and 20S-60S (light dashed lines). (C) Also shown is the annual SH mean temperature record. The light-gray shading highlights the warm 1936–45 decade. The SH temperature record (37) and the Hadley SST2 dataset (21) were obtained from the web site of the Climatic Research Unit, University of East Anglia (Norwich, U.K.).
Fig. 2.
Fig. 2.
Maps showing SST anomalies in °C (color scale) and SLP anomalies (contours every 1 hPA, positive anomalies solid lines and negative anomalies as dashed lines) for the peak of the El Niño event in 1940–41. The black dots in West Antarctica indicate the ice core sites. The sites of the rainfall observations are indicated with green triangles, and the Niño3.4 region is outlined by the rectangle. The SST data are from the Kaplan dataset (20). The SLP data are from the Hadley SLP2 dataset (19). Both datasets were obtained from the Earth System Research Laboratory of the National Oceanic and Atmospheric Administration.
Fig. 3.
Fig. 3.
Time series covering the 1925–1950 period, with the warm 1936–45 decade highlighted by light-gray shading and the 1939–42 El Niño event highlighted by darker-gray shading. (A) Annual resolution West Antarctic ice core index (dark line) and the North Pacific Index (light lines) for the November-March season (23). (B) Monthly data are shown after smoothing with an eight-point Gaussian filter. Included are zonal mean JJA SST for 20N-20S (light solid line) and for 20S-60S (dotted line) as well as the Niño3.4 SST index (22) (heavy solid line). (C) An index of rainfall on central tropical Pacific islands (17). The NPI and Niño3.4 index were obtained from the Climate Analysis Section of the National Center for Atmospheric Research, and the Wright rainfall index was provided by Clara Deser. The SST data are, again, from the HadleySST2 dataset.

References

    1. Rignot E, et al. Recent Antarctic ice mass loss from radar interferometry and regional climate modeling. Nat Geosci. 2008;1:110.
    1. Johanson CM, Fu Q. Antarctic atmospheric temperature trend patterns from satellite observations. Geophys Res Lett. 2007;34:L12703.
    1. Comiso JC. Variability and trends in Antarctic surface temperatures from in situ and satellite infrared measurements. J Clim. 2000;13:1674–1696.
    1. Schneider DP, Steig EJ, Comiso JC. Recent climate variability in Antarctica from satellite-derived temperature data. J Clim. 2004;17:1569–1583.
    1. Monaghan AJ, Bromwich DH, Chapman W, Comiso JC. Recent variability and trends of Antarctic near-surface temperature. J Geophys Res Atmos. 2008a;113:D04105.

Publication types

LinkOut - more resources