. 2008 Aug 13;3(8):e2929.
doi: 10.1371/journal.pone.0002929.

From stop to start: tandem gene arrangement, copy number and trans-splicing sites in the dinoflagellate Amphidinium carterae

Affiliations

From stop to start: tandem gene arrangement, copy number and trans-splicing sites in the dinoflagellate Amphidinium carterae

Tsvetan R Bachvaroff et al. PLoS One. .

Abstract

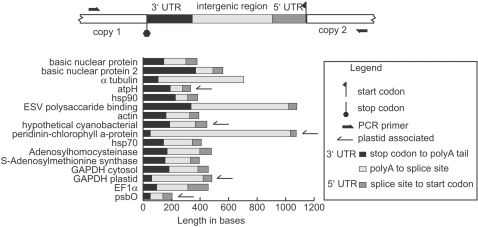
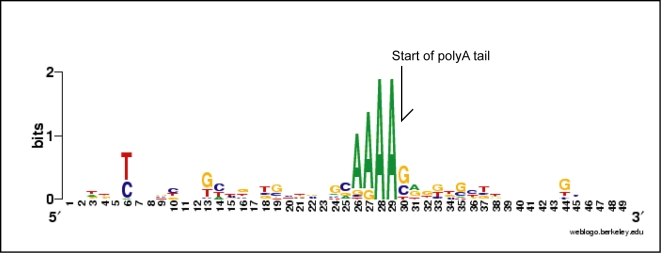
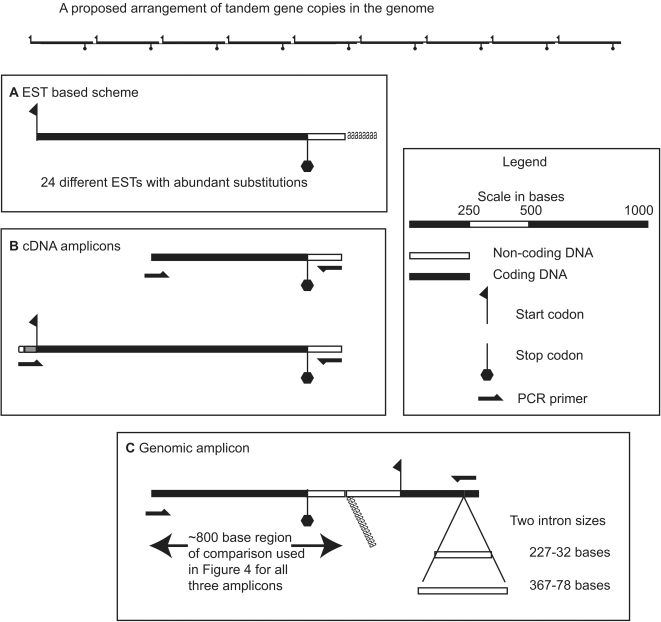
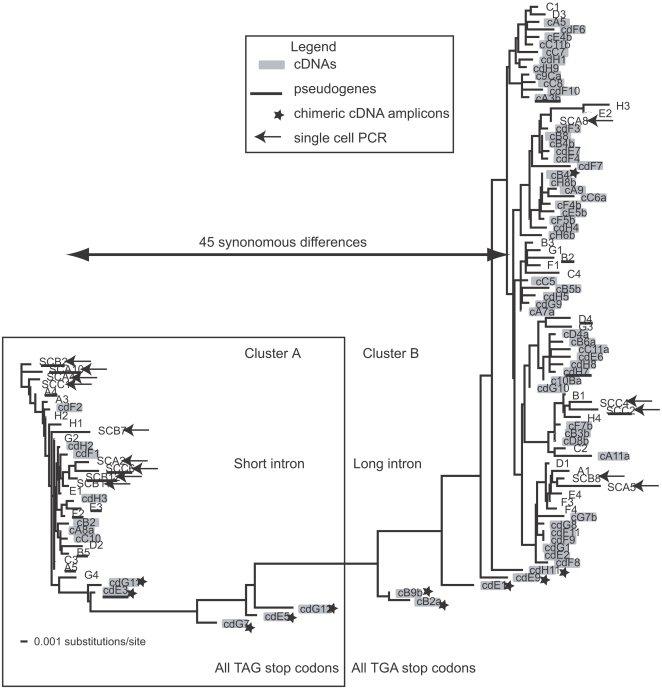
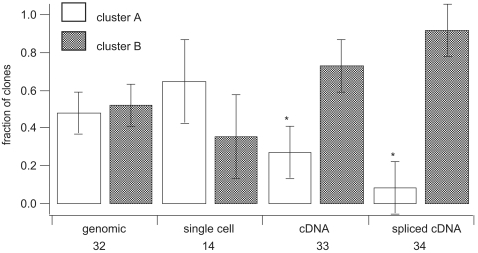
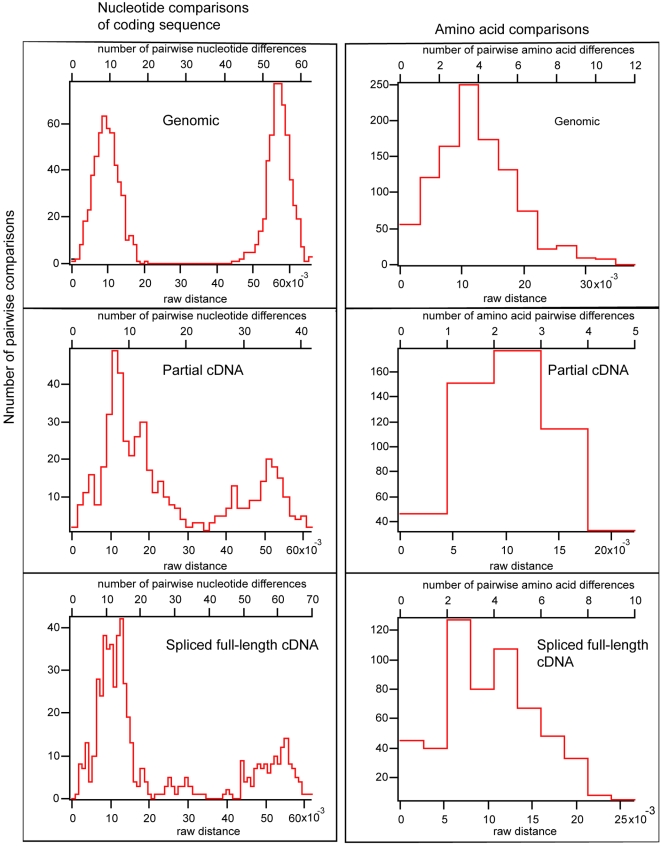
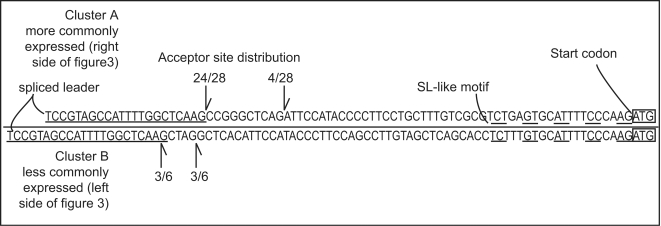
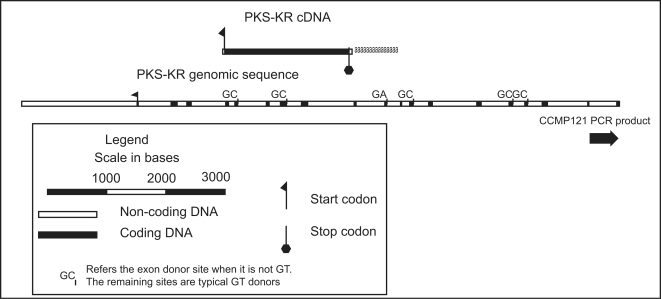
Dinoflagellate genomes present unique challenges including large size, modified DNA bases, lack of nucleosomes, and condensed chromosomes. EST sequencing has shown that many genes are found as many slightly different variants implying that many copies are present in the genome. As a preliminary survey of the genome our goal was to obtain genomic sequences for 47 genes from the dinoflagellate Amphidinium carterae. A PCR approach was used to avoid problems with large insert libraries. One primer set was oriented inward to amplify the genomic complement of the cDNA and a second primer set would amplify outward between tandem repeats of the same gene. Each gene was also tested for a spliced leader using cDNA as template. Almost all (14/15) of the highly expressed genes (i.e. those with high representation in the cDNA pool) were shown to be in tandem arrays with short intergenic spacers, and most were trans-spliced. Only two moderately expressed genes were found in tandem arrays. A polyadenylation signal was found in genomic copies containing the sequence AAAAG/C at the exact polyadenylation site and was conserved between species. Four genes were found to have a high intron density (>5 introns) while most either lacked introns, or had only one to three. Actin was selected for deeper sequencing of both genomic and cDNA copies. Two clusters of actin copies were found, separated from each other by many non-coding features such as intron size and sequence. One intron-rich gene was selected for genomic walking using inverse PCR, and was not shown to be in a tandem repeat. The first glimpse of dinoflagellate genome indicates two general categories of genes in dinoflagellates, a highly expressed tandem repeat class and an intron rich less expressed class. This combination of features appears to be unique among eukaryotes.


Conflict of interest statement

Competing Interests: The authors have declared that no competing interests exist.

Figures

Figure 1
Figure 1. Tandem array intergenic regions from Amphidinium carterae.
At the top of the figure is a schematic proposed arrangement, applying to all the genes in the survey. The outward primer orientation is designed to amplify between two tandemly arranged copies of the same gene. At the bottom the lengths of the different regions, corresponding to the 3′ UTR, an intergenic region, and the 5′ UTR are plotted for each of the different genes. The trans-splicing sites were inferred by comparing cDNA and genomic amplicons. The 3′ UTR was measured by comparing ESTs and genomic sequences. In the case of α tubulin the splice acceptor site is unknown. Although elongation factor 2 was shown to be in a tandem array arrangement, the end of the coding region is ambiguous, and so this gene is not included.
Figure 2
Figure 2. A sequence logo showing the putative polyadenylation sequence for dinoflagellates.
This logo is based on an alignment of the intergenic spacer genomic amplicons of 25 different intergenic spacer sequences from 14 genes. The polyadenylation site was inferred by comparing ESTs to the genomic sequence. The same motif is present in Karlodinium veneficum and Lingulodinium polyedrum.
Figure 3
Figure 3. A schematic representation of the different actin amplicons.
At the top is a hypothetical arrangement of tandem gene copies in the genome showing a long array of repeated gene copies, with short intergenic regions between them, below are different actin amplicons shown at the same scale. A. An mRNA schematic based on an assembly of 24 different ESTs showing stop and start codons, and the polyA tail. B. Two different cDNA amplicons, the shorter of which was amplified with two gene specific primers (33 were sequenced), and a longer amplicon using the trans-spliced leader primer with a gene specific reverse primer (34 were sequenced). C. The genomic amplicon bridging between two adjacent gene copies (46 were sequenced). All schematics are drawn to an equal scale except for the proposed arrangement at the top.
Figure 4
Figure 4. A distance tree using both genomic and expressed versions of the actin gene.
The tree was based on an 800 base coding region common to all amplicons (see Figure 3). The two genomic clusters were cleanly divided based on 45 synonymous substitutions over 800 bases, with no intermediate sequences found in the genomic clones (exemplified by the stop codons in this figure). Other features such as intron sequence, and intergenic spacer sequence also sort the two genomic clusters. Multiple pseudogene versions were also found and are underlined. Expressed sequences are marked with colored boxes and were mostly drawn from a single cluster with several chimeric sequences having features of both genomic clusters (marked with a star).
Figure 5
Figure 5. The sorting of different actin clones between the two clusters of copies.
The different cluster assignments for genomic culture DNA, single cell genomic, and two different cDNA amplicons (see Figure 3 for arrangement) are shown, asterisks indicate significant differences at p<0.05. Below each category the total number of clones sequenced is given. The cluster A and B assignments refer to the location of the clones on figure 3.
Figure 6
Figure 6. Histograms based on pairwise comparisons of actin gene copies.
Based on an alignment of three different actin gene amplicons (diagrammed on figure 3) pairwise distances were calculated comparing the coding regions of three amplicons: genomic, partial cDNA, and full-length trans-spliced cDNAs. Each category was treated individually with only the coding regions compared using both nucleotide (left) and amino acid translations (right). The raw distances are the pairwise differences divided by alignment length. In each case, the nucleotide comparisons delimit two different clusters of actin gene copies that are indistinguishable based on amino acid translations.
Figure 7
Figure 7. Actin cDNA 5′ UTRs showing trans-splice acceptor sites.
The 5′ UTRs for the two gene clusters, one above the line and the other below the line, showing the different inferred trans-splice acceptor sites. The top sequence represents the more commonly expressed cluster (right side of tree in figure 3) and the lower sequence is rarely expressed (left side of tree in figure 3). Numbers indicate frequency of the splicing pattern in the 34 sequenced cDNAs. The trans-spliced leader sequence is underlined, a spliced leader like motif is also underlined (dashed line) just before the start codon (boxed).
Figure 8
Figure 8. A scaled schematic representation of the polyketide synthase (PKS) genomic and cDNA sequence.
Exons, donor sites, and the start codon are shown, the genomic sequence does not extend to the stop codon, but does extend well upstream of the start codon. The location of the amplicon from a second toxin-producing strain of Amphidinium carterae CCMP121 is also shown. When atypical intron donors are present the actual dinucleotide donor is shown at the edge of the intron.

References

    1. LaJeunesse TC, Lambert G, Andersen RA, Coffroth MA, Galbraith DW. Symbiodinium (Pyrrhophyta) genome sizes (DNA content) are smallest among dinoflagellates. J Phycol. 2005;41:880–886.
    1. Rae P. Hydroxymethyluracil in eukaryote DNA: a natural feature of the pyrrophyta (dinoflagellates). Science. 1976;194:1062–1064. - PubMed
    1. Rizzo PJ, Nooden LD. Chromosomal proteins in the dinoflagellate alga Gyrodinium cohnii. Science. 1972;176:796–797. - PubMed
    1. Haapala O, Soyer -Gobillard M. Structure of dinoflagellate chromosomes. Nature. 1973;244:195–197. - PubMed
    1. Bjornland T, Tangen K. Pigmentation and morphology of a marine Gyrodinium (dinophyceae) with a major carotenoid different from peridinin and fucoxanthin. J Phycol. 1979;15:457–463.

Publication types