. 2008 Sep;7(9):3900-10.
doi: 10.1021/pr800198w. Epub 2008 Aug 13.

Identification of c-Src tyrosine kinase substrates using mass spectrometry and peptide microarrays

Affiliations

Identification of c-Src tyrosine kinase substrates using mass spectrometry and peptide microarrays

Ramars Amanchy et al. J Proteome Res. 2008 Sep.

Abstract

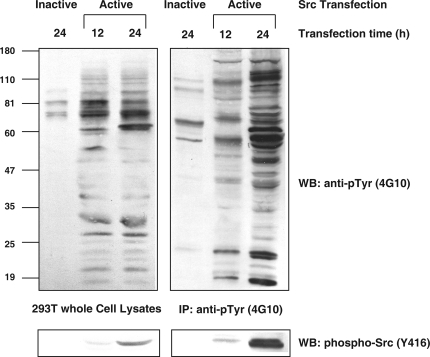
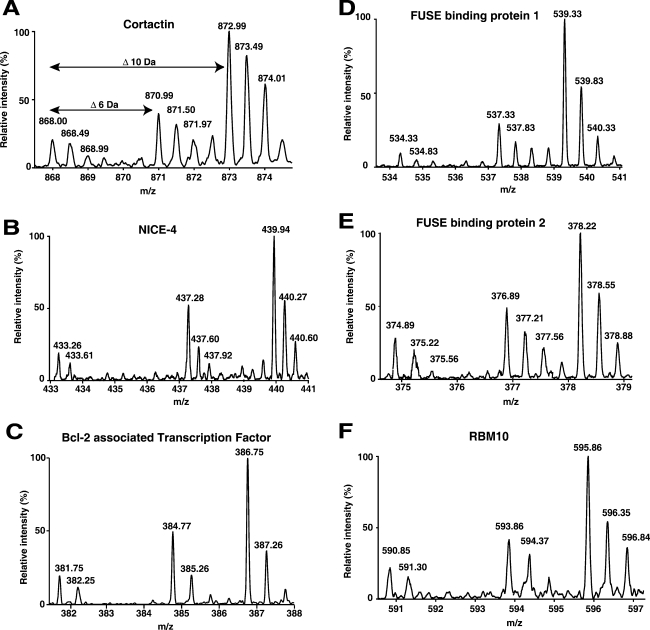
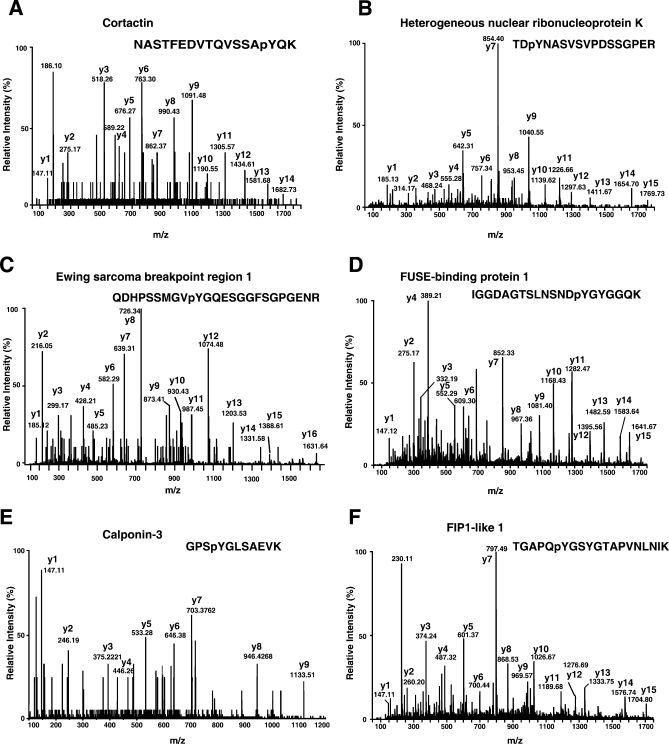
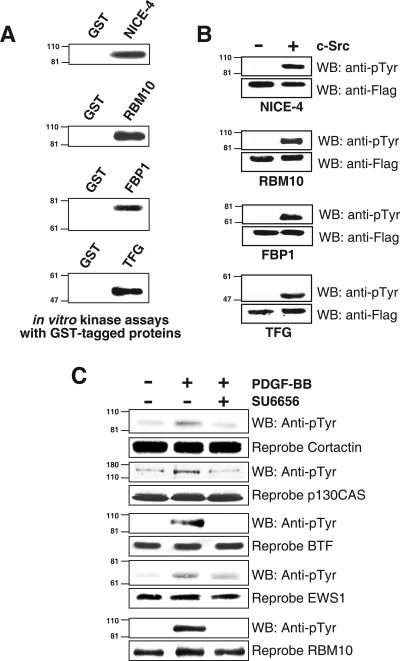
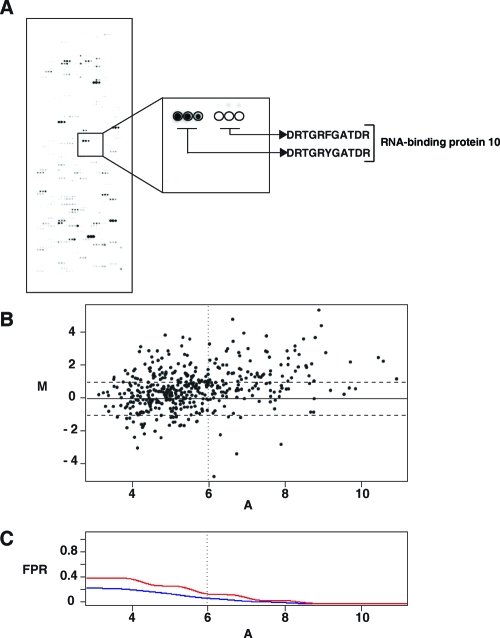
c-Src tyrosine kinase plays a critical role in signal transduction downstream of growth factor receptors, integrins and G protein-coupled receptors. We used stable isotope labeling with amino acids in cell culture (SILAC) approach to identify additional substrates of c-Src tyrosine kinase in human embryonic kidney 293T cells. We have identified 10 known substrates and interactors of c-Src and Src family kinases along with 26 novel substrates. We have experimentally validated 4 of the novel proteins (NICE-4, RNA binding motif 10, FUSE-binding protein 1 and TRK-fused gene) as direct substrates of c-Src using in vitro kinase assays and cotransfection experiments. Significantly, using a c-Src specific inhibitor, we were also able to implicate 3 novel substrates (RNA binding motif 10, EWS1 and Bcl-2 associated transcription factor) in PDGF signaling. Finally, to identify the exact tyrosine residues that are phosphorylated by c-Src on the novel c-Src substrates, we designed custom peptide microarrays containing all possible tyrosine-containing peptides (312 unique peptides) and their mutant counterparts containing a Tyr --> Phe substitution from 14 of the identified substrates. Using this platform, we identified 34 peptides that are phosphorylated by c-Src. We have demonstrated that SILAC-based quantitative proteomics approach is suitable for identification of substrates of nonreceptor tyrosine kinases and can be coupled with peptide microarrays for high-throughput identification of substrate phosphopeptides.


Figures

Figure 1
Figure 1
(A) Schematic for the integrated proteomic approach for the identification of c-Src kinase substrates. Human embryonic kidney (HEK) 293T cells growing in Arg ‘0’ containing medium were transiently transfected with a kinase-dead Src (K298M) and 293T cells growing in Arg ‘6’ and Arg ‘10’ were transiently transfected with constitutively active Src kinase (Y527F). Arg ‘0’ refers to 12C6-arginine, Arg ‘6’ refers to 13C6-arginine and Arg ‘10’ refers to 13C6-15N4-arginine, isotopic labeled forms of arginine used to differentially label 293T cells for identification of Src substrates.
Figure 2
Figure 2
Tyrosine phosphorylation profile of proteins on transfection with inactive and active forms of c-Src. 293T cells were transfected with inactive and active forms of c-Src, cells were lysed, and tyrosine-phosphorylated proteins were immunoprecipitated from the cell lysates as described in . Cell lysates and immunoprecipitates were then run on a 10% SDS-PAGE and transferred to nitrocellulose membranes. The membranes were probed with anti-phosphotyrosine antibodies and reprobed with phospho (Y416)-Src antibody.
Figure 3
Figure 3
MS spectra of 6 proteins identified as Src substrates by SILAC. The 3 spectral peaks in each figure represent the mass shift of the same peptide. The relative increase in intensity ratios between light to heavy are represented below in parentheses. (A) A doubly charged peptide from cortactin (1:7); (B) a triply charged peptide from NICE-4 (1:7); (C) a doubly charged peptide from Bcl2-associated transcription factor (1:7.5); (D) a doubly charged peptide from FUSE-binding protein 1 (1:8); (E) a doubly charged peptide from FUSE-binding protein 2 (1:4); (F) a doubly charged peptide from RNA binding motif 10 (1:7.5).
Figure 4
Figure 4
MS/MS spectra of novel phosphorylation sites identified in this study. (A) Phosphopeptide NASTFEDVTQVSSApYQK derived from Cortactin; (B) phosphopeptide TDpYNASVSVPDSSGPER derived from hnRNPK; (C) phosphopeptide QDHPSSMGVpYGQESGGFSGPGENR derived from Ewing sarcoma breakpoint region 1; (D) phosphopeptide IGGDAGTSLNSNDpYGYGGQK derived from FUSE-binding protein 1; (E) phosphopeptide GPSpYGLSAEVK derived from Calponin-3; (F) phosphopeptide TGAPQpYGSYGTAPVNLNIK derived from FIP1-like 1.
Figure 5
Figure 5
Experimental validation of tyrosine phosphorylation of proteins obtained from c-Src kinase overexpression in 293T cells. (A) In vitro kinase assays using GST tagged proteins and c-Src using a rabbit reticulocyte in vitro transcription and translation system. (B) 293T cells were cotransfected with genes of interest along with either empty vector PCMVtag4A or with c-Src. Culture media was changed 12 h after transfection and cells were serum-starved for 12 h and lysed 48 h after transfection. Proteins were immunoprecipitated using anti-Flag antibodies and Western blotting was performed using phosphotyrosine antibodies and reprobed. (C) Validation of a subset of proteins in PDGF signaling. NIH3T3 cells have been grown to confluence and serum-starved for 12 h followed by stimulation with PDGF-BB (100 ng/mL for 5 min) and PDGF stimulation after treatment with SU6656 (2 μM for 1 h prior to lysis or stimulation), and cell lysates were subjected to immunoprecipitation using anti-phosphotyrosine antibodies, probed with respective antibodies, and reprobed in whole cell lysates.
Figure 6
Figure 6
(A) Peptide microarrays: in vitro kinase assays performed on peptide microarrays, where all tyrosine containing peptides and their corresponding Y → F mutant counterparts were spotted on glass slides. A representative section of the peptide microarray is magnified to show the signal corresponding to a peptide and its Y → F mutant. (B) A classical MvA plot displaying data pertaining phosphorylation intensities on peptide microarrays. The horizontal dotted lines indicate 2-fold difference between WT and MUT intensity values. The vertical dotted line corresponds to a local false positive rate of 0.15. M on the Y-axis represents differential of (log 2 WT − log 2 MUT intensity values for each peptide and A on the X-axis represents average intensities ([log 2 WT + log 2 MUT]/2). (C) A plot displaying classical and local false positive rates (FPR). The red line represents local false positive rate curve and the blue line represents the classical false positive rate. The vertical dotted line shows where the local FPR = 0.15. All peptides to the right of the vertical dotted line and above 2-fold (horizontal line) were selected as true positives.

References

    1. Thomas S. M.; Brugge J. S. Cellular functions regulated by Src family kinases. Annu. Rev. Cell Dev. Biol. 1997, 13, 513–609. - PubMed
    1. Olsen J. V.; Blagoev B.; Gnad F.; Macek B.; Kumar C.; Mortensen P.; Mann M. Global, in vivo, and site-specific phosphorylation dynamics in signaling networks. Cell 2006, 127, 635–648. - PubMed
    1. Ficarro S. B.; McCleland M. L.; Stukenberg P. T.; Burke D. J.; Ross M. M.; Shabanowitz J.; Hunt D. F.; White F. M. Phosphoproteome analysis by mass spectrometry and its application to Saccharomyces cerevisiae. Nat. Biotechnol. 2002, 20, 301–305. - PubMed
    1. Beausoleil S. A.; Villen J.; Gerber S. A.; Rush J.; Gygi S. P. A probability-based approach for high-throughput protein phosphorylation analysis and site localization. Nat. Biotechnol. 2006, 24, 1285–1292. - PubMed
    1. Molina H.; Horn D. M.; Tang N.; Mathivanan S.; Pandey A. Global proteomic profiling of phosphopeptides using electron transfer dissociation tandem mass spectrometry. Proc. Natl. Acad. Sci. U.S.A. 2007, 104, 2199–2204. - PMC - PubMed

Publication types