Review
. 2008 Aug 12:2:74.
doi: 10.1186/1752-0509-2-74.

A review of imaging techniques for systems biology

Affiliations
Review

A review of imaging techniques for systems biology

Armen R Kherlopian et al. BMC Syst Biol. .

Abstract

This paper presents a review of imaging techniques and of their utility in system biology. During the last decade systems biology has matured into a distinct field and imaging has been increasingly used to enable the interplay of experimental and theoretical biology. In this review, we describe and compare the roles of microscopy, ultrasound, CT (Computed Tomography), MRI (Magnetic Resonance Imaging), PET (Positron Emission Tomography), and molecular probes such as quantum dots and nanoshells in systems biology. As a unified application area among these different imaging techniques, examples in cancer targeting are highlighted.


Figures
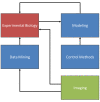
Figure 1
Figure 1
Components of systems biology. Systems biology supplements experimental biology by providing methods to both interpret and validate new findings. Data mining provides a way to gain insight from large data sets, while control methods facilitate the interplay of modeling and experimental biology. Imaging can be used for qualitative assessments during experiments and also provide a large amount of data amenable for data mining.
Figure 2
Figure 2
Fluorescent protein applications. (a) Three Madin-Darby canine kidney epithelial cells with GFP-rac1 and dsRed-E-cadherin. Rac1 is a pleiotropic signaling molecule that is closely associated with cell-cell adhesion and cell motility. E-cadherin is a cell-cell adhesion protein responsible for facilitating communication between two contacting cells. Scale bar: 10 μm. Contributed by Lance Kam (Columbia University, New York). (b) Membranes of human umbilical cord endothelial cells visualized using EYFP. Scale bar: 40 μm. (c) GFP-actin labeled human umbilical cord endothelial cell undergoing mitosis, with actin filaments aligned toward the centrioles. Scale bar: 30 μm. Contributed by Samuel Sia (Columbia University, New York).
Figure 3
Figure 3
Two-photon microscopy of in vivo brain function. (a) Basic mechanism of two-photon fluorescence. (b) Schematic of surgical preparation of exposed cortex, with sealed glass window and microscope objective positioning. Green dot shows location of two-photon fluorescence. (c) Examples of two-photon maps of the vasculature following intravenous injection of dextran-conjugated fluorescein. Black dots and stripes show red blood cell motion. (d) Dual-channel imaging of neuronal (green) and vascular (red) signals: (left) Oregon Green 488 BAPTA-1 AM calcium sensitive dye stained neurons and (right) transgenic mouse expressing green fluorescent protein (GFP) in a subpopulation of neurons (mouse supplied by Jeffrey M. Friedman, Rockefeller University, New York) [101]. Texas dextran red is the intravascular tracer in both cases. (e) Three channel imaging of Tg2576 APP Alzheimer's disease mouse model with amyloid-targeting dye (blue), GFP expressing neurons and dendrites (green) and vasculature (red). Adapted from [52] and contributed by Elizabeth Hillman (Columbia University, New York).
Figure 4
Figure 4
Transthoracic echocardiography and elastography of a healthy human left ventricle. (a), (b), (c), and (d) are the lateral, axial, radial, and circumferential systolic strains from myocardial elastography between end diastole and end systole, respectively. Strains are displayed on a scale of ± 50%. All the images were acquired approximately at the papillary muscle level and shown at end systole. Contributed by Elisa Konofagou (Columbia University, New York).
Figure 5
Figure 5
Complete volumetric decomposition procedure on a vertebral trabecular bone sample. (a) Example microCT bone volumetric data. (b) Closer view of plate and rod microstructures. (c) MicroCT image of a trabecular bone sample. (d) Completely decomposed trabecular bone structures with individual trabeculae labeled by color for each voxel. Image volume: 5 mm3. Contributed by X. Edward Guo (Columbia University, New York).
Figure 6
Figure 6
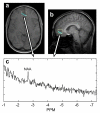
In vivo point resolved (single voxel) MRI spectroscropy. (a) Axial and (b) sagital views of human brain and outlined voxel for MRS. (c) 1H spectrum with readily visible N-acetylaspartate (NAA) peak. An aberrant NAA peak can be an indicator of brain injury or disease.
Figure 7
Figure 7
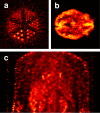
Phantom and anatomical PET images. (a) 11C PET image of a rod phantom. (b) FDG PET image of a brain. (c) Coronal view of thoracic area from a whole body PET scan.
Figure 8
Figure 8
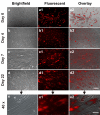
Quantum dot labeled human mesenchymal stem cells undergoing proliferation. hMSCs were incubated for 16 hrs in a 30 nM solution of bioconjugated QDs (a-a2). Following the removal of extracellular QDs, QD-labeled hMSCs and unlabeled hMSCs of the same subpopulation were continuously cultured for 4, 7 and 22 days (b-b2, c-c2, d-d2, respectively). Scale bar: 30 μm. QDs were internalized in the cytoplasm, even after 22 days of culture-expansion (e-e2), apparently endocytosed as aggregates. Scale bar: 5 μm. Reproduced from [89] and contributed by Jeremy Mao (Columbia University, New York).
Figure 9
Figure 9
Near field images of an Ag nanoshell. Nanoshell exposed to (a) 721 nm, (b) 492 nm, and (c) 336 nm laser beam and consequential dipole, quadrupole, and dark plasmons, respectively. Surface plasmon oscillations are collective electron motion resultant of optical illumination, and subsequent modes are shown. Adapted from [102].
Figure 10
Figure 10
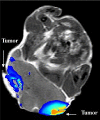
Ablation of two tumors in a mouse. With exposure to an external infrared laser source, the nanoshells resonate and thermally destroy tumor cells and their respective vasculature. Adapted from [103].
Figure 11
Figure 11
Resolution spectrum of imaging techniques. The schematic shows the resolution gap between microscopy and anatomical imaging. Metabolic imaging has successfully been linked to anatomical imaging despite having lower resolution. The schematic axis is linear.

References

    1. Dhar PK, Zhu H, Mishra SK. Computational approach to systems biology: from fraction to integration and beyond. IEEE Trans Nanobioscience. 2004;3:144–152. - PubMed
    1. Gambhir SS. Molecular imaging of cancer with positron emission tomography. Nature Reviews Cancer. 2002;2:683–693. - PubMed
    1. Ideker T, Galitski T, Hood L. A new approach to decoding life: systems biology. Annu Rev Genomics Hum Genet. 2001;2:343–372. - PubMed
    1. Kitano H. Foundations of Systems Biology. Cambridge, MA, The MIT Press; 2001. p. 320.
    1. Kitano H. Systems biology: a brief overview. Science. 2002;295:1662–1664. - PubMed

Substances