

Spatial-temporal analysis of breast cancer in upper Cape Cod, Massachusetts
- PMID: 18700963
- PMCID: PMC2538515
- DOI: 10.1186/1476-072X-7-46
Spatial-temporal analysis of breast cancer in upper Cape Cod, Massachusetts
Abstract
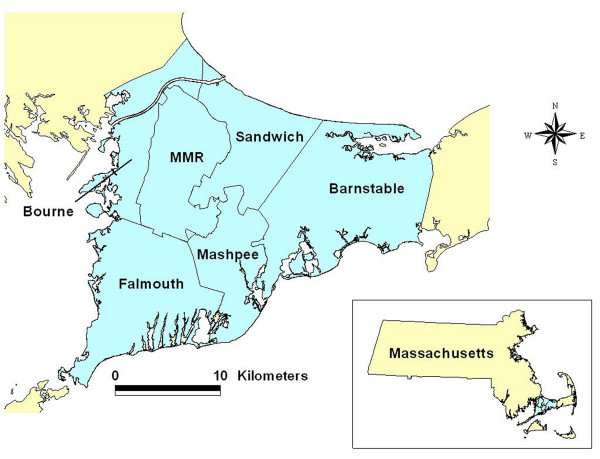
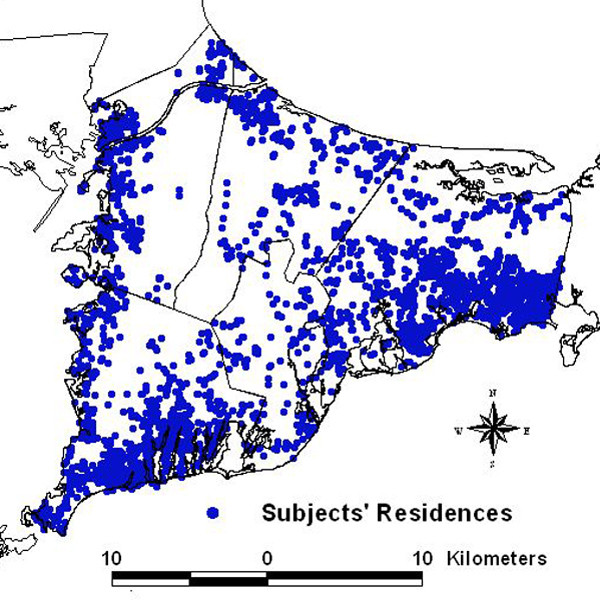
Introduction: The reasons for elevated breast cancer rates in the upper Cape Cod area of Massachusetts remain unknown despite several epidemiological studies that investigated possible environmental risk factors. Data from two of these population-based case-control studies provide geocoded residential histories and information on confounders, creating an invaluable dataset for spatial-temporal analysis of participants' residency over five decades.
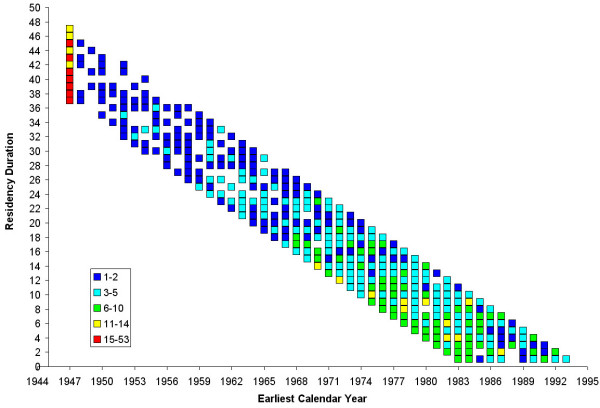
Methods: The combination of statistical modeling and mapping is a powerful tool for visualizing disease risk in a spatial-temporal analysis. Advances in geographic information systems (GIS) enable spatial analytic techniques in public health studies previously not feasible. Generalized additive models (GAMs) are an effective approach for modeling spatial and temporal distributions of data, combining a number of desirable features including smoothing of geographical location, residency duration, or calendar years; the ability to estimate odds ratios (ORs) while adjusting for confounders; selection of optimum degree of smoothing (span size); hypothesis testing; and use of standard software. We conducted a spatial-temporal analysis of breast cancer case-control data using GAMs and GIS to determine the association between participants' residential history during 1947-1993 and the risk of breast cancer diagnosis during 1983-1993. We considered geographic location alone in a two-dimensional space-only analysis. Calendar year, represented by the earliest year a participant lived in the study area, and residency duration in the study area were modeled individually in one-dimensional time-only analyses, and together in a two-dimensional time-only analysis. We also analyzed space and time together by applying a two-dimensional GAM for location to datasets of overlapping calendar years. The resulting series of maps created a movie which allowed us to visualize changes in magnitude, geographic size, and location of elevated breast cancer risk for the 40 years of residential history that was smoothed over space and time.
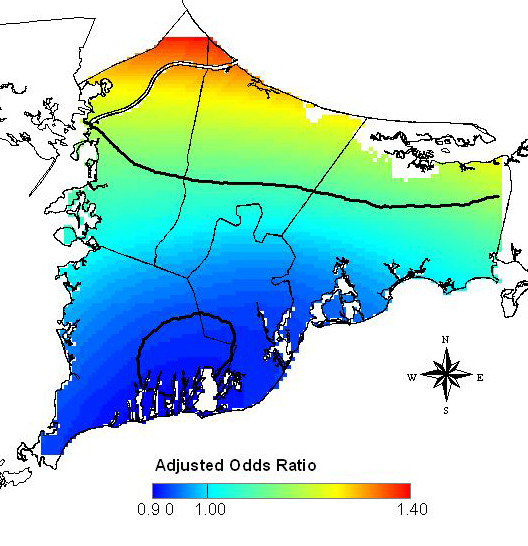
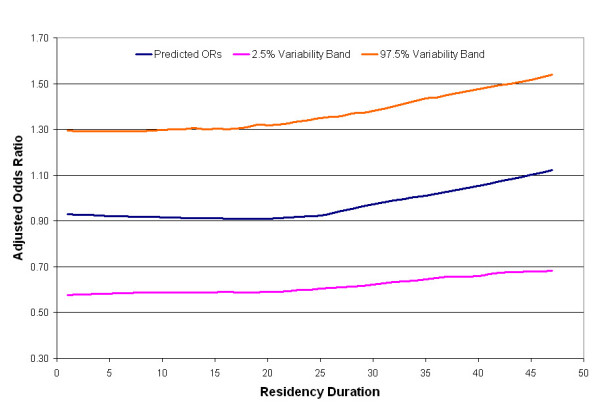
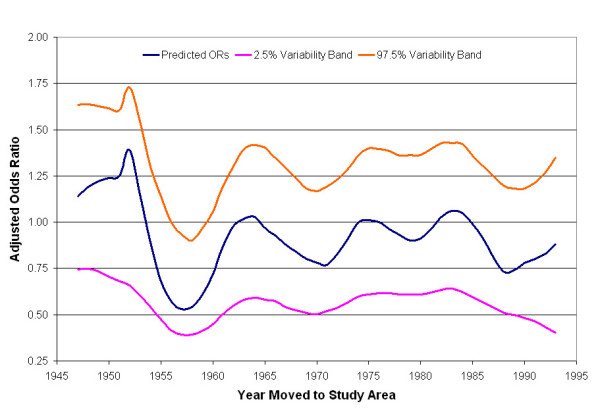
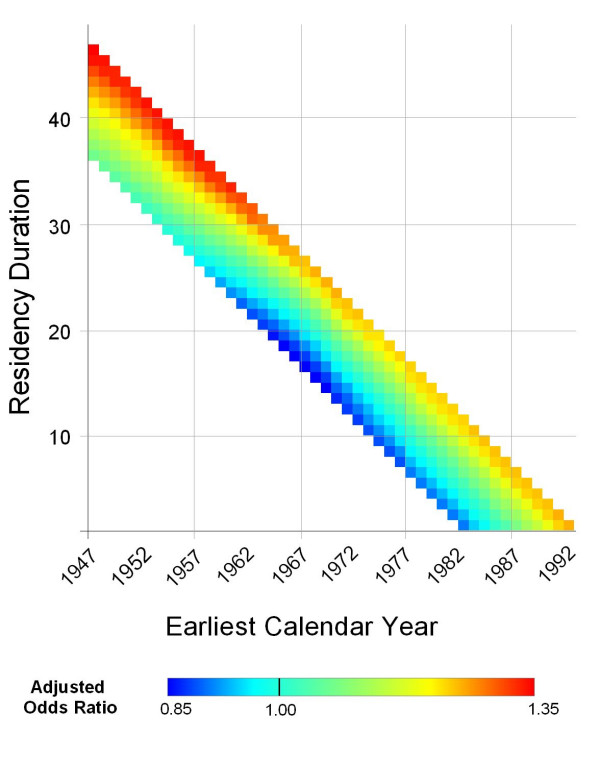
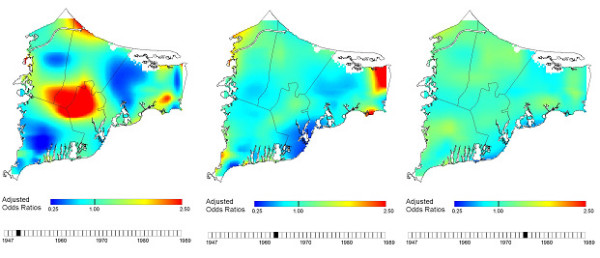
Results: The space-only analysis showed statistically significant increased areas of breast cancer risk in the northern part of upper Cape Cod and decreased areas of breast cancer risk in the southern part (p-value = 0.04; ORs: 0.90-1.40). There was also a significant association between breast cancer risk and calendar year (p-value = 0.05; ORs: 0.53-1.38), with earlier calendar years resulting in higher risk. The results of the one-dimensional analysis of residency duration and the two-dimensional analysis of calendar year and duration showed that the risk of breast cancer increased with increasing residency duration, but results were not statistically significant. When we considered space and time together, the maps showed a large area of statistically significant elevated risk for breast cancer near the Massachusetts Military Reservation (p-value range:0.02-0.05; ORs range: 0.25-2.5). This increased risk began with residences in the late 1940s and remained consistent in size and location through the late 1950s.
Conclusion: Spatial-temporal analysis of the breast cancer data may help identify new exposure hypotheses that warrant future epidemiologic investigations with detailed exposure models. Our methods allow us to visualize breast cancer risk, adjust for known confounders including age at diagnosis or index year, family history of breast cancer, parity and age at first live- or stillbirth, and test for the statistical significance of location and time. Despite the advantages of GAMs, analyses are for exploratory purposes and there are still methodological issues that warrant further research. This paper illustrates that GAM methods are a suitable alternative to widely-used cluster detection methods and may be preferable when residential histories from existing epidemiological studies are available.
Figures
References
-
- Rothman K. A sobering start for the cluster busters' conference. Am J Epidemiol. 1990;132:S6–S13. - PubMed
-
- Polissar L. The effect of migration on comparison of disease rates in geographic studies in the United States. Am J Epidemiol. 1980;111:175–182. - PubMed
-
- Neutra RR. Counterpoint from a cluster buster. Am J Epidemiol. 1990;132:1–8. - PubMed
-
- Wartenberg D. Investigating disease clusters: Why, when, how? J Royal Statist Soc A. 2001;164:13–22. doi: 10.1111/1467-985X.00181. - DOI
-
- Aschengrau A, Ozonoff D. Upper Cape Cancer Incidence Study Final Report. Boston: Massachusetts Department of Public Health; 1992.
Publication types
MeSH terms
Grants and funding
LinkOut - more resources
Full Text Sources
Medical
Molecular Biology Databases
