

The miR-17-5p microRNA is a key regulator of the G1/S phase cell cycle transition
- PMID: 18700987
- PMCID: PMC2575517
- DOI: 10.1186/gb-2008-9-8-r127
The miR-17-5p microRNA is a key regulator of the G1/S phase cell cycle transition
Abstract
Background: MicroRNAs are modifiers of gene expression, acting to reduce translation through either translational repression or mRNA cleavage. Recently, it has been shown that some microRNAs can act to promote or suppress cell transformation, with miR-17-92 described as the first oncogenic microRNA. The association of miR-17-92 encoded microRNAs with a surprisingly broad range of cancers not only underlines the clinical significance of this locus, but also suggests that miR-17-92 may regulate fundamental biological processes, and for these reasons miR-17-92 has been considered as a therapeutic target.
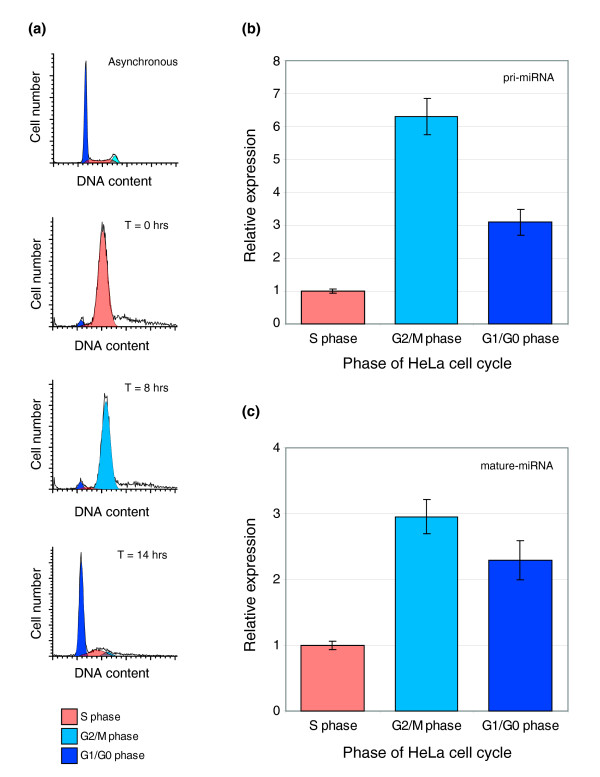
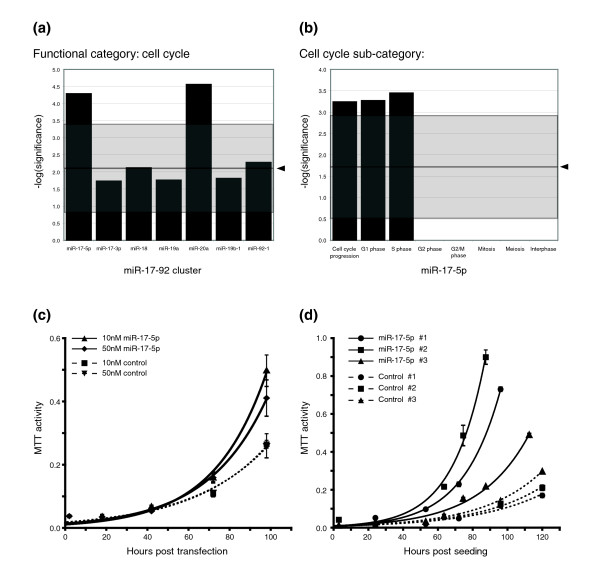
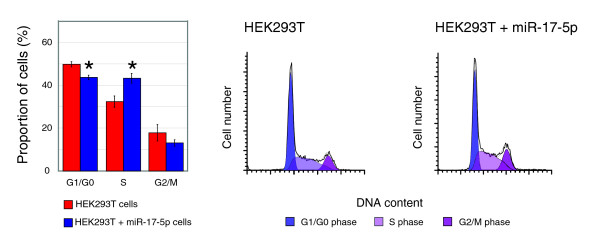
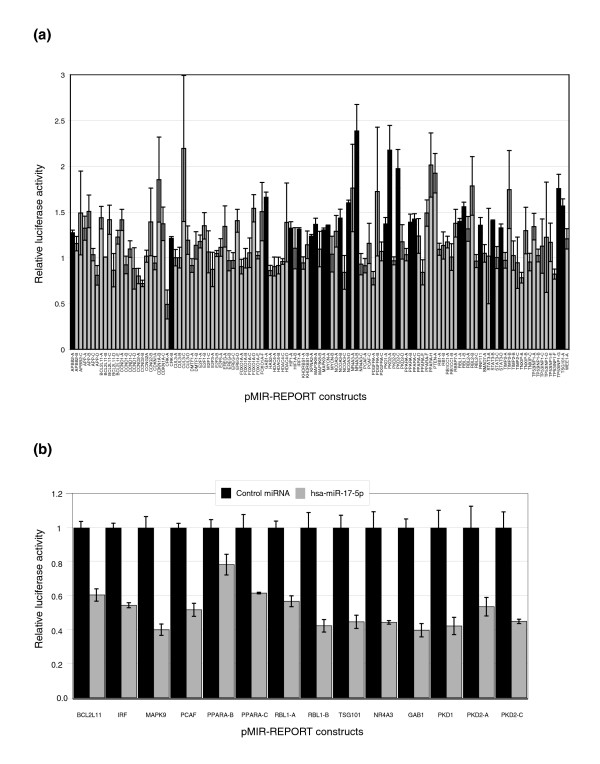
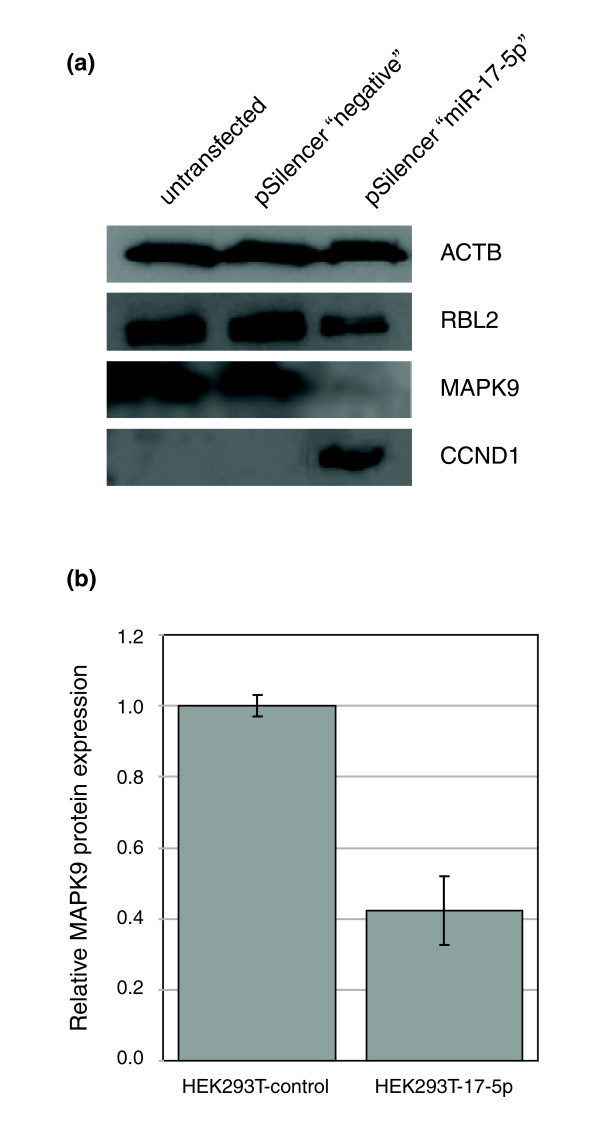
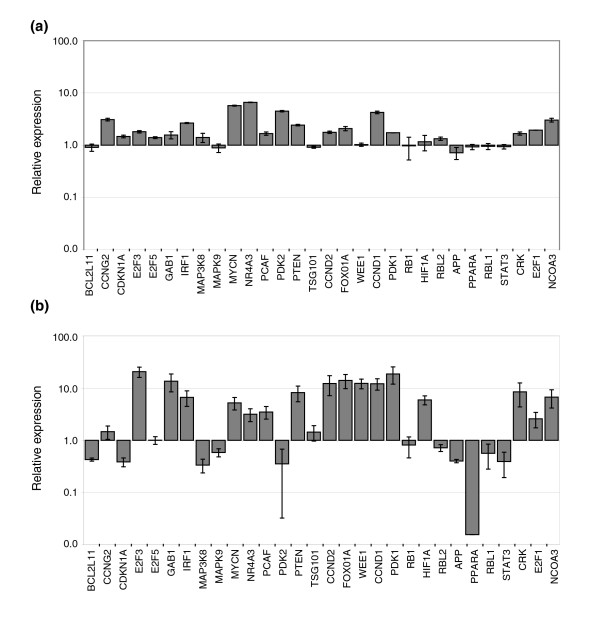
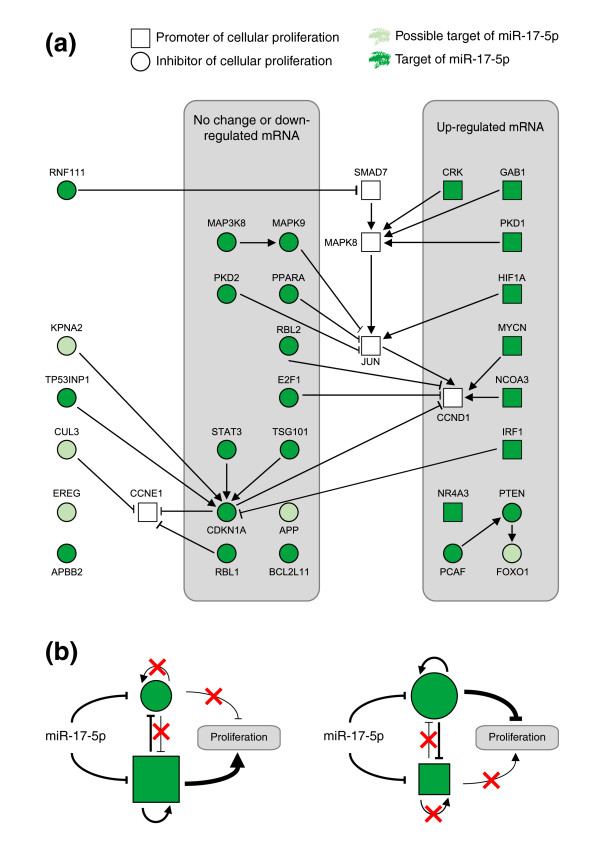
Results: In this study, we show that miR-17-92 is a cell cycle regulated locus, and ectopic expression of a single microRNA (miR-17-5p) is sufficient to drive a proliferative signal in HEK293T cells. For the first time, we reveal the mechanism behind this response - miR-17-5p acts specifically at the G1/S-phase cell cycle boundary, by targeting more than 20 genes involved in the transition between these phases. While both pro- and anti-proliferative genes are targeted by miR-17-5p, pro-proliferative mRNAs are specifically up-regulated by secondary and/or tertiary effects in HEK293T cells.
Conclusion: The miR-17-5p microRNA is able to act as both an oncogene and a tumor suppressor in different cellular contexts; our model of competing positive and negative signals can explain both of these activities. The coordinated suppression of proliferation-inhibitors allows miR-17-5p to efficiently de-couple negative regulators of the MAPK (mitogen activated protein kinase) signaling cascade, promoting growth in HEK293T cells. Additionally, we have demonstrated the utility of a systems biology approach as a unique and rapid approach to uncover microRNA function.
Figures
Similar articles
-
Oxidative Stress Down-Regulates MiR-20b-5p, MiR-106a-5p and E2F1 Expression to Suppress the G1/S Transition of the Cell Cycle in Multipotent Stromal Cells.Int J Med Sci. 2020 Feb 4;17(4):457-470. doi: 10.7150/ijms.38832. eCollection 2020. Int J Med Sci. 2020. PMID: 32174776 Free PMC article.
-
Down-regulation of cyclin E1 expression by microRNA-195 accounts for interferon-β-induced inhibition of hepatic stellate cell proliferation.J Cell Physiol. 2011 Oct;226(10):2535-42. doi: 10.1002/jcp.22598. J Cell Physiol. 2011. PMID: 21792910
-
Senescence-associated microRNAs target cell cycle regulatory genes in normal human lung fibroblasts.Exp Gerontol. 2017 Oct 1;96:110-122. doi: 10.1016/j.exger.2017.06.017. Epub 2017 Jun 27. Exp Gerontol. 2017. PMID: 28658612
-
Regulation of the MIR155 host gene in physiological and pathological processes.Gene. 2013 Dec 10;532(1):1-12. doi: 10.1016/j.gene.2012.12.009. Epub 2012 Dec 14. Gene. 2013. PMID: 23246696 Review.
-
Critical Considerations for Investigating MicroRNAs during Tumorigenesis: A Case Study in Conceptual and Contextual Nuances of miR-211-5p in Melanoma.Epigenomes. 2023 Apr 26;7(2):9. doi: 10.3390/epigenomes7020009. Epigenomes. 2023. PMID: 37218870 Free PMC article. Review.
Cited by
-
Exosomes mediate the cytoprotective action of mesenchymal stromal cells on hypoxia-induced pulmonary hypertension.Circulation. 2012 Nov 27;126(22):2601-11. doi: 10.1161/CIRCULATIONAHA.112.114173. Epub 2012 Oct 31. Circulation. 2012. PMID: 23114789 Free PMC article.
-
Genomic imbalances and microRNA transcriptional profiles in patients with mycosis fungoides.Tumour Biol. 2016 Oct;37(10):13637-13647. doi: 10.1007/s13277-016-5259-8. Epub 2016 Jul 29. Tumour Biol. 2016. PMID: 27473081
-
Re-thinking miRNA-mRNA interactions: intertwining issues confound target discovery.Bioessays. 2015 Apr;37(4):379-88. doi: 10.1002/bies.201400191. Epub 2015 Feb 12. Bioessays. 2015. PMID: 25683051 Free PMC article.
-
A microRNA signature and TGF-β1 response were identified as the key master regulators for spaceflight response.PLoS One. 2018 Jul 25;13(7):e0199621. doi: 10.1371/journal.pone.0199621. eCollection 2018. PLoS One. 2018. PMID: 30044882 Free PMC article.
-
The Network of Non-coding RNAs in Cancer Drug Resistance.Front Oncol. 2018 Aug 29;8:327. doi: 10.3389/fonc.2018.00327. eCollection 2018. Front Oncol. 2018. PMID: 30211115 Free PMC article. Review.
References
-
- Hayashita Y, Osada H, Tatematsu Y, Yamada H, Yanagisawa K, Tomida S, Yatabe Y, Kawahara K, Sekido Y, Takahashi T. A polycistronic microRNA cluster, miR-17-92, is overexpressed in human lung cancers and enhances cell proliferation. Cancer Research. 2005;65:9628–9632. doi: 10.1158/0008-5472.CAN-05-2352. - DOI - PubMed
Publication types
MeSH terms
Substances
LinkOut - more resources
Full Text Sources
Other Literature Sources
