. 2008 Aug 14;59(3):475-85.
doi: 10.1016/j.neuron.2008.07.006.

Local dendritic activity sets release probability at hippocampal synapses

Affiliations

Local dendritic activity sets release probability at hippocampal synapses

Tiago Branco et al. Neuron. .

Abstract

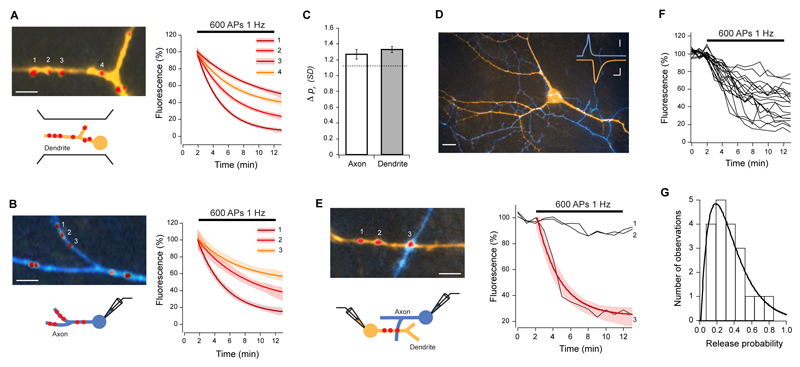
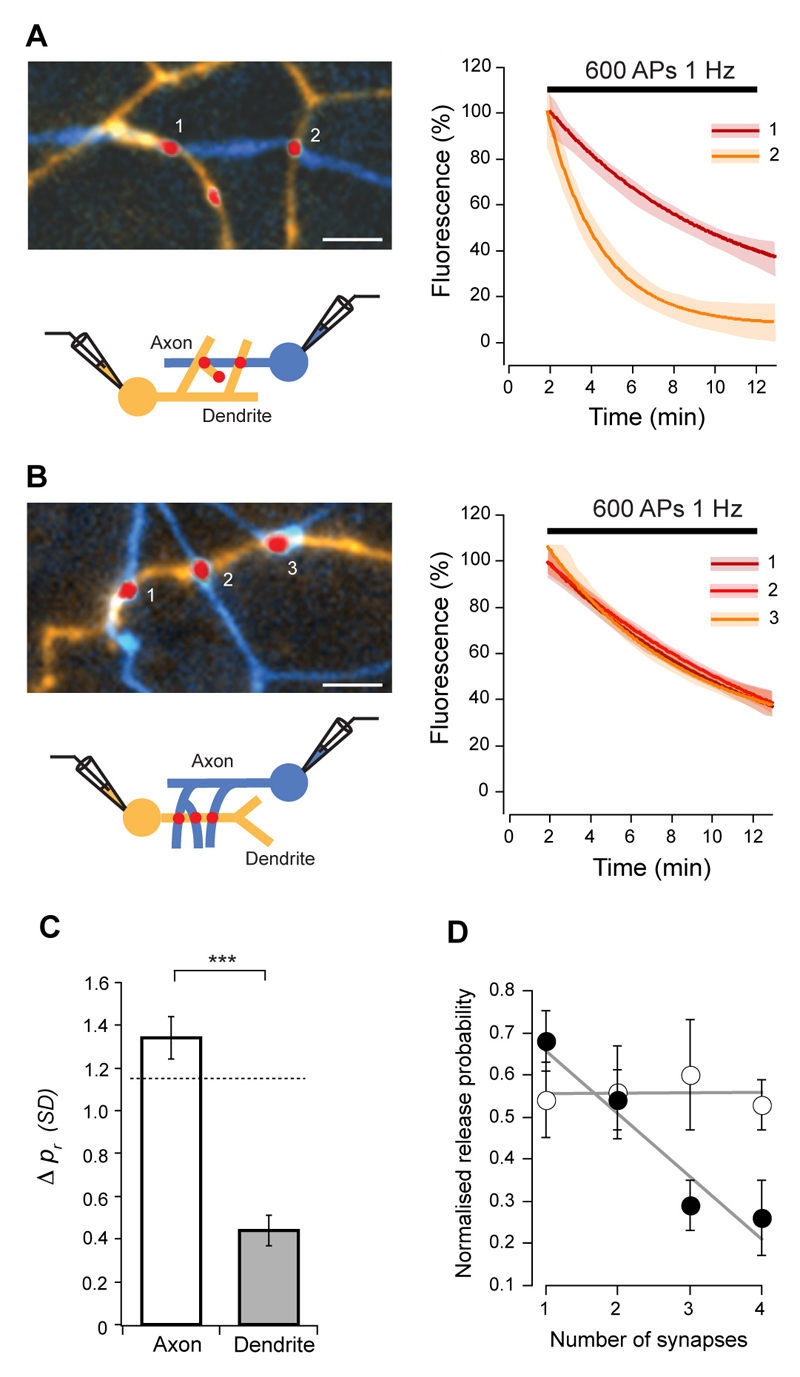
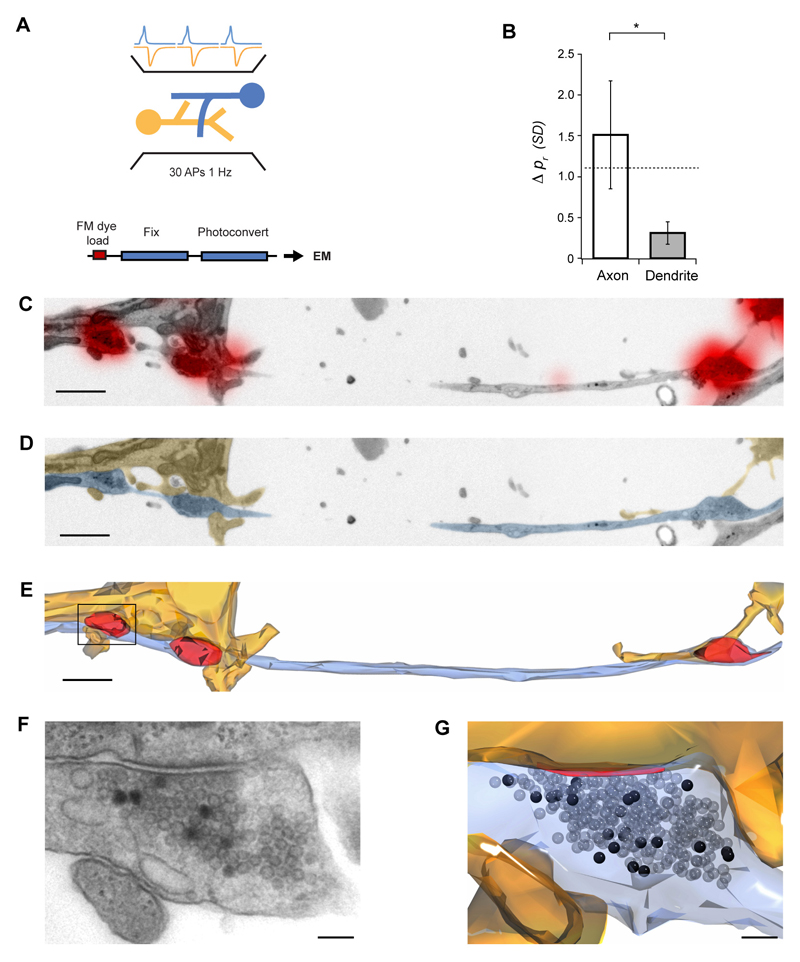
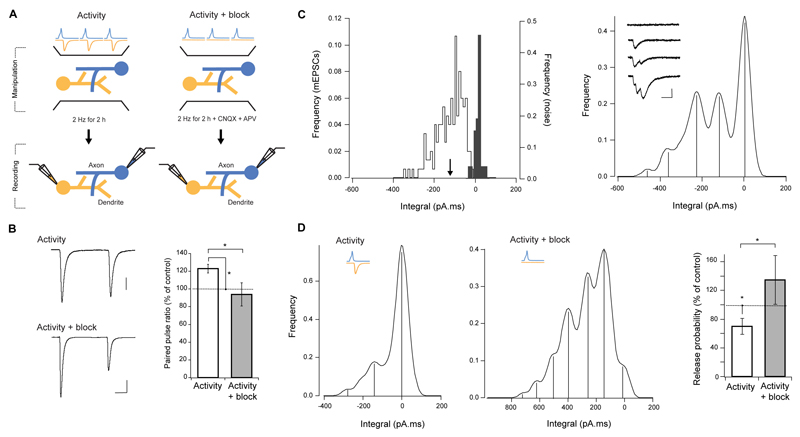
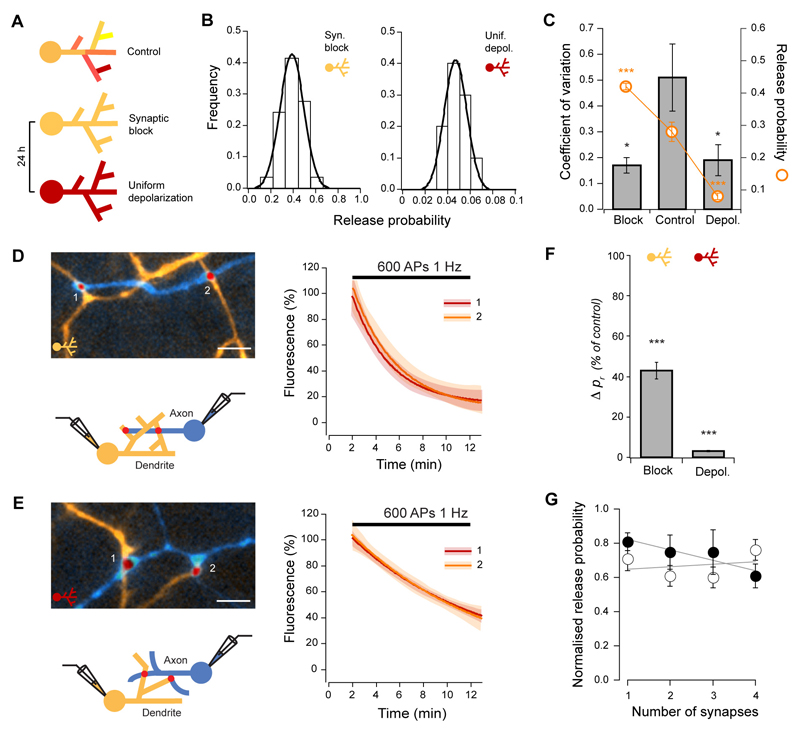
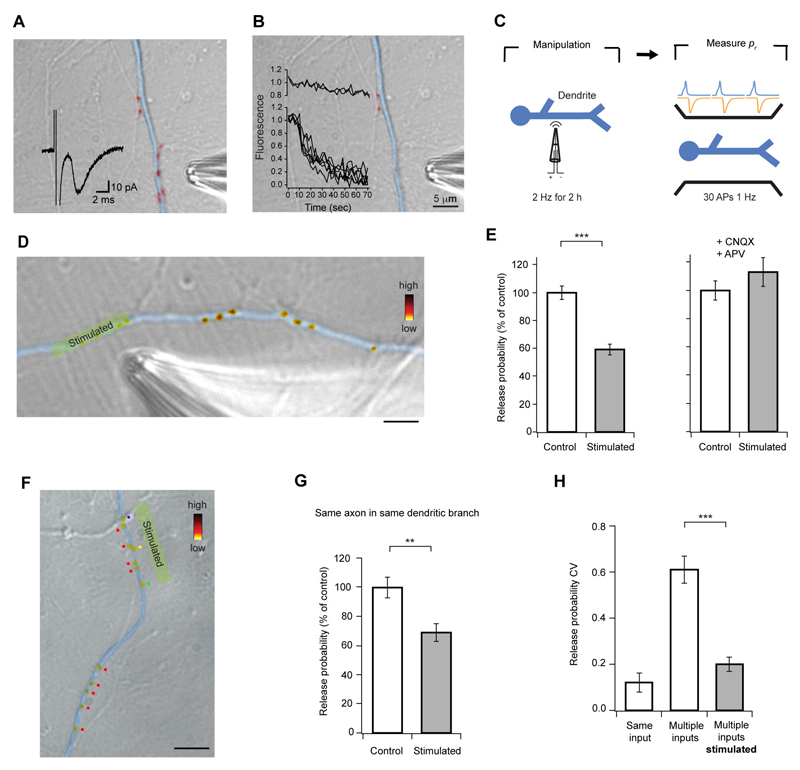
The arrival of an action potential at a synapse triggers neurotransmitter release with a limited probability, p(r). Although p(r) is a fundamental parameter in defining synaptic efficacy, it is not uniform across all synapses, and the mechanisms by which a given synapse sets its basal release probability are unknown. By measuring p(r) at single presynaptic terminals in connected pairs of hippocampal neurons, we show that neighboring synapses on the same dendritic branch have very similar release probabilities, and p(r) is negatively correlated with the number of synapses on the branch. Increasing dendritic depolarization elicits a homeostatic decrease in p(r), and equalizing activity in the dendrite significantly reduces its variability. Our results indicate that local dendritic activity is the major determinant of basal release probability, and we suggest that this feedback regulation might be required to maintain synapses in their operational range.


Conflict of interest statement

The authors declare no competing financial interests.

Figures

Figure 1
Figure 1. Variability of release probability.
Release probability was measured by labeling synapses with FM-dye and monitoring destaining rates upon action potential stimulation, delivered by field stimulation (A), or during single (B) and paired (E) whole-cell recordings. (A) Left, dendrite (orange) with FM4-64 labeled synapses (red). Right, destaining curve fits with 95% confidence interval (shaded areas) for the numbered synapses show a wide range of release probabilities for synapses in the same dendritic branch. (B) Left, axon (blue) with several synapses (red), and respective destaining curve fits (right), also show very different prs for synapses along single axons. (C) Summary data of similarity comparisons for all synapses in a branch of dendrite or axon, showing that the mean pr difference is not significantly different from the average pr difference expected by chance (1.13 SDs, Wilcoxon rank sum test for axon P = 0.4241, dendrite P = 0.2079). (D) Epifluorescence image of axon (blue) making multiple synaptic contacts (red, FM4-64) with a postsynaptic cell (orange). Inset: representative traces of AP (blue) and evoked EPSC (orange). Scale bars, 15 μm; inset, 2 ms, 20 mV (top), 100 pA (bottom). (E) Stimulation of the presynaptic cell selectively destains FM4-64 fluorescence from the synapse belonging to the labeled axon (3), and not from those originating from unlabeled axons (1,2). Red line is a single exponential fit. (F, G) Destaining traces from 19 synapses from one connection (F) and corresponding release probability frequency histogram (G). Solid line is gamma function fit (λ = 5.8, n = 3).
Figure 2
Figure 2. Release probability is dendritically segregated.
(A, B) Images (left) and destaining curve fits (right) for synaptic contacts between a cell pair, on different (A) or same dendritic branches (B) of the postsynaptic neuron (axon is blue and dendrite is orange). Release probability of synapses in the same dendritic branch is very similar. (C) Summary of similarity comparisons between synapse pairs. Dashed line indicates expected mean difference due to chance from Monte Carlo simulations (1.15 SDs, Wilcoxon rank sum test for axon P = 0.1023, dendrite P < 0.0001). Mean intersynaptic distances were not significantly different (axon vs. dendrite, P = 0.1406, axon = 8.5 ± 5.3 μm (SD), dendrite = 5.9 ± 3.0 μm (SD)). (D) Normalized release probability plotted against number of synapses in the axonal branch (open circles) and in the dendritic branch (closed circles). pr homeostatically adapts to the number of synapses made by the presynaptic cell onto the same dendritic branch. Lines are linear fits to the data. Scale bars, 5 μm. Error bars are ± s.e.m.
Figure 3
Figure 3. Ultrastructural analysis of release probability.
(A) Experimental scheme. FM-dye was loaded into synapses with 30 APs delivered by field stimulation, and samples were photoconverted, serially sectioned, imaged and reconstructed. Release probability was estimated by counting the number of photoconverted vesicles. (B) Summary of similarity comparisons, showing that synapses on the same dendrite have very similar release probabilities (axon vs. dendrite, P = 0.0438). Dashed line indicates the expected difference due to chance from Monte Carlo simulations (1.1 SDs, Wilcoxon rank sum test for axon P = 0.8750, dendrite P = 0.0156). (C-E) Representative experiment showing one axon (blue) making synapses (red) with two different dendrites (orange). (C) Low magnification electron micrograph with FM-dye fluorescence overlaid. (D) Same micrograph as in D with axon and dendrite colored for clarity. (E) 3-D reconstruction with vesicle clusters in red. (F) Higher magnification micrograph of the boxed synapse in F where photoconverted vesicles are clearly seen. (G) 3-D reconstruction of the same synapse with photoconverted vesicles (black) and active zone (red). Scale bar in (C-E), 1 μm, (F, G), 100 nm. Error bars are ± s.e.m.
Figure 4
Figure 4. Release probability is set by dendritic activity.
(A) Two experimental schemes: activity (left) and activity + block (right). (Left) Activity in the culture was increased by delivering APs with field stimulation for 2 h, and paired whole-cell recordings were used to access the impact of this manipulation on release probability. (Right) For activity + block condition, a similar experimental scheme was used, but excitatory synaptic activity was blocked during stimulation. (B) Example paired-pulse EPSC traces (left, averages of 20) and summary of paired-pulse EPSC amplitude ratio (right), showing an increase of PPR with activity, which is abolished by synaptic blockers. Scale bars, 15 ms, 200 pA top, 100 pA bottom. (C, D) Recordings in 1 mM Ca2+ / 3 mM Mg2+. (C, left) Frequency histogram of mEPSCs integral (white) and baseline noise (gray). Arrowhead indicates the mEPSC integral mean. (C, right) Smoothed histogram of evoked responses integral on the same postsynaptic cell, showing well defined peaks at equally spaced distances. Note that first two peaks correspond to the baseline noise and mEPSC mean in the left panel. Inset shows example traces where different number of quanta have been released. Scale bar, 2 ms, 50 pA. (D) Increasing activity leads to a significant decrease in release probability, which is abolished by blocking excitatory synaptic transmission. Smoothed integral histograms of evoked responses for example connections are shown, after increased activity alone (left), and with synaptic blockers (centre). (D, right) Summary of pr changes for all connections.
Figure 5
Figure 5. Variability of release probability results from local adaptations to dendritic activity.
(A) Experimental scheme. Inputs to the dendrite were made uniform pharmacologically by treating cultures for 24 h under ‘synaptic block’ (CNQX, APV, bicuculline) or ‘uniform depolarization’ (CNQX, APV, bicuculline, 20 mM KCl). Release probability was measured by the FM-dye destaining rate in paired recordings, as in Figs. 1 and 2. (B) Frequency histograms for two example connections show opposite changes in pr for synaptic block (left) vs. uniform depolarization (right). Lines are Gaussian fits. Note change in the shape of the distribution compared with Fig. 1D. (C) Data summary showing significant decreases in global pr CV, and homeostatic changes in pr, (D, E), Example connections of synapses on different dendrites (left), and respective fits to FM4-64 destaining curves (right) for synaptic block (D) and uniform depolarization (E). Scale bars, 5 μm. (F) Summary of similarity comparisons for both conditions, show that the mean pr difference for synapses on different dendrites is significantly reduced after the activity manipulations. (G) Release probability normalized for each connection plotted against the number of synapses in the dendrite for block (open circles) and uniform depolarization (closed circles). The relationship between pr and synapse density is lost (see Fig. 2D). Lines are linear fits to the data.
Figure 6
Figure 6. Local stimulation decreases release probability selectively.
(A, B) Theta-glass pipette stimulation produces a localized synaptic response. (A) Synapses were labeled with FM-dye (red), and a whole-cell recording established. A EPSC (inset trace) was evoked by positioning the stimulating pipette in front of a group of synapses on the dendrite of the recorded cell (colored in blue for clarity), confirming successful synaptic stimulation. (B) The same synapses were stimulated by 1200 APs at 20 Hz, and FM-dye fluorescence monitored. Inset graph shows that only the group of synapses directly in front of the pipette lost FM-dye fluorescence, indicating high spatial selectivity of the stimulus. (C) Local stimulation was used to increase synaptic activity in a restricted part of a dendritic branch, and pr estimated subsequently by loading synapses with FM-dye. (D) Example DIC image of a dendritic branch with a group of synapses, which were stimulated for 2 h, with superimposed pseudocolored FM4-64 puncta. Fluorescence intensity represents pr. Scale bar, 5 μm. (E) Data summary showing that pr decreases only in stimulated synapses, and that this effect is abolished by synaptic blockers. (F) Another example image of the same experiment shown in D, where synapses of interest have been categorized according to the axon they belong to (color dots, see Fig. S6 for details on axon tracing procedure). Scale bar, 10 μm. (G) Data summary showing that local stimulation selectively decreases pr even if synapses on the dendritic branch belong to the same presynaptic input. (H) Summary data demonstrating that pr of synapses from different inputs becomes similar after stimulation. Error bars are ± s.e.m.

Similar articles

Cited by

References

    1. Atwood HL, Bittner GD. Matching of excitatory and inhibitory inputs to crustacean muscle fibers. J Neurophysiol. 1971;34:157–170. - PubMed
    1. Bacci A, Coco S, Pravettoni E, Schenk U, Armano S, et al. Chronic blockade of glutamate receptors enhances presynaptic release and downregulates the interaction between synaptophysin-synaptobrevin-vesicle-associated membrane protein 2. J Neurosci. 2001;21:6588–6596. - PMC - PubMed
    1. Bennett MR, Jones P, Lavidis NA. The probability of quantal secretion along visualized terminal branches at amphibian (Bufo marinus) neuromuscular synapses. J Physiol. 1986;379:257–274. - PMC - PubMed
    1. Biró AA, Holderith NB, Nusser Z. Quantal size is independent of the release probability at hippocamapl excitatory synapses. J Neurosci. 2005;25:233–232. - PMC - PubMed
    1. Burrone J, Murthy VN. Synaptic gain control and homeostasis. Curr Opin Neurobiol. 2003;13:560–567. - PubMed

Publication types

MeSH terms