

Differential age-related changes in mitochondrial DNA repair activities in mouse brain regions
- PMID: 18701195
- PMCID: PMC2858237
- DOI: 10.1016/j.neurobiolaging.2008.07.004
Differential age-related changes in mitochondrial DNA repair activities in mouse brain regions
Abstract
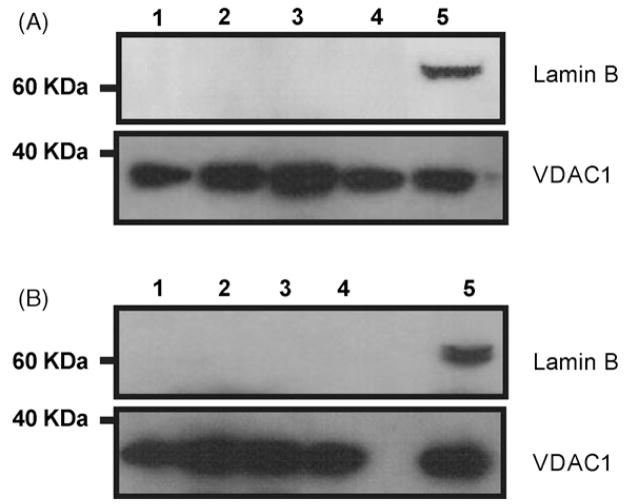
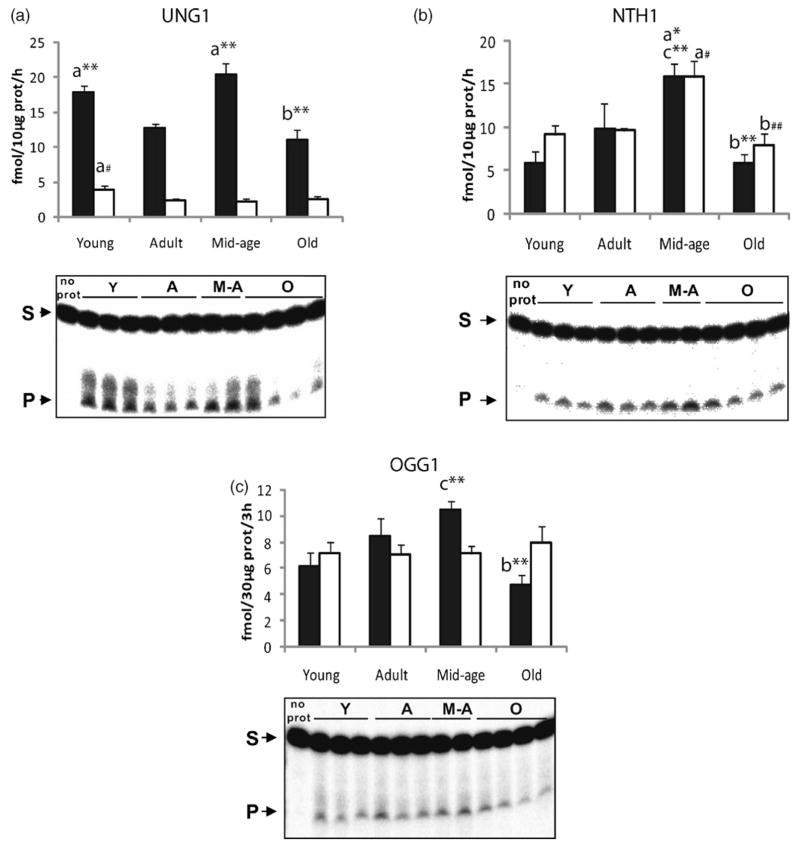
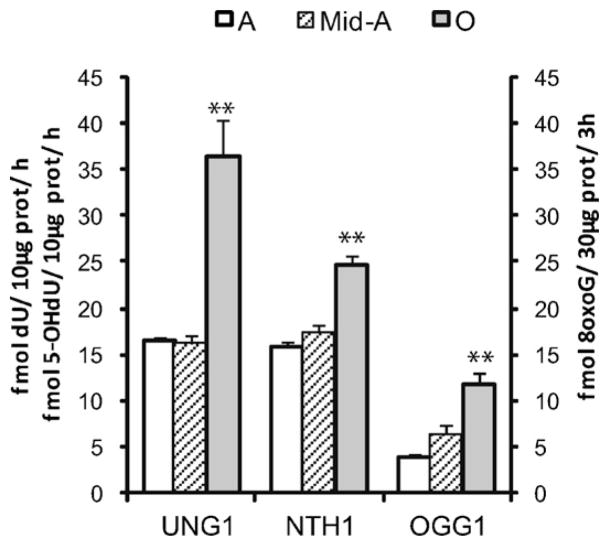
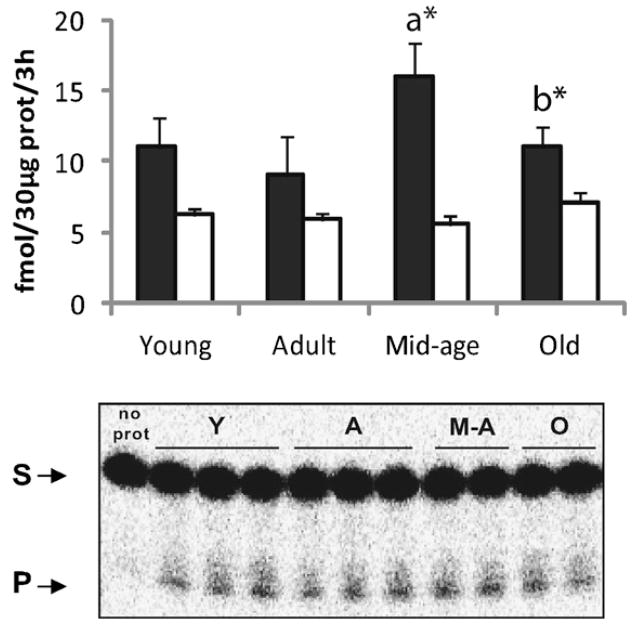
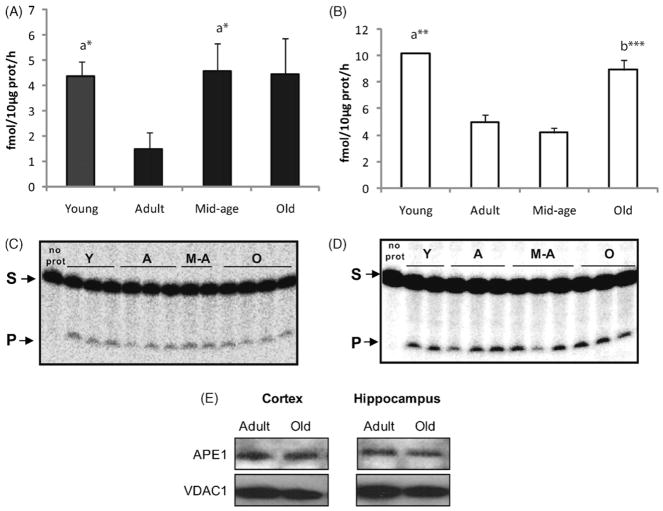
Aging in the brain is characterized by increased susceptibility to neuronal loss and functional decline, and mitochondrial DNA (mtDNA) mutations are thought to play an important role in these processes. Due to the proximity of mtDNA to the main sites of mitochondrial free radical generation, oxidative stress is a major source of DNA mutations in mitochondria. The base excision repair (BER) pathway removes oxidative lesions from mtDNA, thereby constituting an important mechanism to avoid accumulation of mtDNA mutations. The complexity of the brain implies that exposure and defence against oxidative stress varies among brain regions and hence some regions may be particularly prone to accumulation of mtDNA damages. In the current study we investigated the efficiency of the BER pathway throughout the murine lifespan in mitochondria from cortex and hippocampus, regions that are central in mammalian cognition, and which are severely affected during aging and in neurodegenerative diseases. A regional specific regulation of mitochondrial DNA repair activities was observed with aging. In cortical mitochondria, DNA glycosylase activities peaked at middle-age followed by a significant drop at old age. However, only minor changes were observed in hippocampal mitochondria during the whole lifespan of the animals. Furthermore, DNA glycosylase activities were lower in hippocampal than in cortical mitochondria. Mitochondrial AP endonuclease activity increased in old animals in both brain regions. Our data suggest an important regional specific regulation of mitochondrial BER during aging.
Copyright 2008 Elsevier Inc. All rights reserved.
Figures
Similar articles
-
Mitochondrial DNA repair and association with aging--an update.Exp Gerontol. 2010 Aug;45(7-8):478-88. doi: 10.1016/j.exger.2010.01.017. Epub 2010 Jan 22. Exp Gerontol. 2010. PMID: 20096766 Free PMC article. Review.
-
DNA base excision repair activities and pathway function in mitochondrial and cellular lysates from cells lacking mitochondrial DNA.Nucleic Acids Res. 2004 Apr 23;32(7):2181-92. doi: 10.1093/nar/gkh533. Print 2004. Nucleic Acids Res. 2004. PMID: 15107486 Free PMC article.
-
Different organization of base excision repair of uracil in DNA in nuclei and mitochondria and selective upregulation of mitochondrial uracil-DNA glycosylase after oxidative stress.Neuroscience. 2007 Apr 14;145(4):1201-12. doi: 10.1016/j.neuroscience.2006.10.010. Epub 2006 Nov 13. Neuroscience. 2007. PMID: 17101234
-
Mitochondrial and nuclear DNA base excision repair are affected differently by caloric restriction.FASEB J. 2004 Mar;18(3):595-7. doi: 10.1096/fj.03-0890fje. Epub 2004 Jan 20. FASEB J. 2004. PMID: 14734635
-
[Progress of enzyme in mitochondrial DNA repair system].Yi Chuan. 2004 Mar;26(2):274-82. Yi Chuan. 2004. PMID: 15640002 Review. Chinese.
Cited by
-
Nuclear and mitochondrial DNA repair in selected eukaryotic aging model systems.Oxid Med Cell Longev. 2012;2012:282438. doi: 10.1155/2012/282438. Epub 2012 Sep 24. Oxid Med Cell Longev. 2012. PMID: 23050036 Free PMC article. Review.
-
The multifaceted roles of DNA repair and replication proteins in aging and obesity.DNA Repair (Amst). 2021 Mar;99:103049. doi: 10.1016/j.dnarep.2021.103049. Epub 2021 Jan 21. DNA Repair (Amst). 2021. PMID: 33529944 Free PMC article. Review.
-
Mitochondrial DNA repair and association with aging--an update.Exp Gerontol. 2010 Aug;45(7-8):478-88. doi: 10.1016/j.exger.2010.01.017. Epub 2010 Jan 22. Exp Gerontol. 2010. PMID: 20096766 Free PMC article. Review.
-
Minimizing the damage: repair pathways keep mitochondrial DNA intact.Nat Rev Mol Cell Biol. 2012 Oct;13(10):659-71. doi: 10.1038/nrm3439. Epub 2012 Sep 20. Nat Rev Mol Cell Biol. 2012. PMID: 22992591 Review.
-
Active transcriptomic and proteomic reprogramming in the C. elegans nucleotide excision repair mutant xpa-1.Worm. 2013 Oct 1;2(4):e27337. doi: 10.4161/worm.27337. Epub 2013 Dec 5. Worm. 2013. PMID: 24744987 Free PMC article.
References
-
- Abd El Mohsen MM, Iravani MM, Spencer JP, Rose S, Fahim AT, Motawi TM, Ismail NA, Jenner P. Age-associated changes in protein oxidation and proteasome activities in rat brain: modulation by antioxidants. Biochem Biophys Res Commun. 2005;336:386–391. - PubMed
-
- Akbari M, Visnes T, Krokan HE, Otterlei M. Mitochondrial base excision repair of uracil and AP sites takes place by single-nucleotide insertion and long-patch DNA synthesis. DNA Repair (Amst) 2008;7:605–616. - PubMed
-
- Barja G. Mitochondrial oxygen radical generation and leak: sites of production in states 4 and 3, organ specificity, and relation to aging and longevity. J Bioenerg Biomembr. 1999;31:347–366. - PubMed
-
- Barja G, Herrero A. Oxidative damage to mitochondrial DNA is inversely related to maximum life span in the heart and brain of mammals. FASEB J. 2000;14:312–318. - PubMed
-
- Beal MF. Mitochondria take center stage in aging and neurodegeneration. Ann Neurol. 2005;58:495–505. - PubMed
Publication types
MeSH terms
Substances
Grants and funding
LinkOut - more resources
Full Text Sources
Medical
