Nonlinear modeling of causal interrelationships in neuronal ensembles
- PMID: 18701382
- PMCID: PMC2729787
- DOI: 10.1109/TNSRE.2008.926716
Nonlinear modeling of causal interrelationships in neuronal ensembles
Abstract
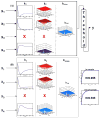
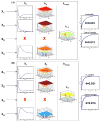
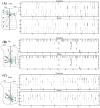
The increasing availability of multiunit recordings gives new urgency to the need for effective analysis of "multidimensional" time-series data that are derived from the recorded activity of neuronal ensembles in the form of multiple sequences of action potentials--treated mathematically as point-processes and computationally as spike-trains. Whether in conditions of spontaneous activity or under conditions of external stimulation, the objective is the identification and quantification of possible causal links among the neurons generating the observed binary signals. A multiple-input/multiple-output (MIMO) modeling methodology is presented that can be used to quantify the neuronal dynamics of causal interrelationships in neuronal ensembles using spike-train data recorded from individual neurons. These causal interrelationships are modeled as transformations of spike-trains recorded from a set of neurons designated as the "inputs" into spike-trains recorded from another set of neurons designated as the "outputs." The MIMO model is composed of a set of multiinput/single-output (MISO) modules, one for each output. Each module is the cascade of a MISO Volterra model and a threshold operator generating the output spikes. The Laguerre expansion approach is used to estimate the Volterra kernels of each MISO module from the respective input-output data using the least-squares method. The predictive performance of the model is evaluated with the use of the receiver operating characteristic (ROC) curve, from which the optimum threshold is also selected. The Mann-Whitney statistic is used to select the significant inputs for each output by examining the statistical significance of improvements in the predictive accuracy of the model when the respective inputs is included. Illustrative examples are presented for a simulated system and for an actual application using multiunit data recordings from the hippocampus of a behaving rat.
Figures


Similar articles
-
Nonlinear dynamic modeling of spike train transformations for hippocampal-cortical prostheses.IEEE Trans Biomed Eng. 2007 Jun;54(6 Pt 1):1053-66. doi: 10.1109/TBME.2007.891948. IEEE Trans Biomed Eng. 2007. PMID: 17554824
-
Tracking temporal evolution of nonlinear dynamics in hippocampus using time-varying volterra kernels.Annu Int Conf IEEE Eng Med Biol Soc. 2008;2008:4996-9. doi: 10.1109/IEMBS.2008.4650336. Annu Int Conf IEEE Eng Med Biol Soc. 2008. PMID: 19163839
-
System identification of point-process neural systems using probability based Volterra kernels.J Neurosci Methods. 2015 Jan 30;240:179-92. doi: 10.1016/j.jneumeth.2014.11.013. Epub 2014 Dec 3. J Neurosci Methods. 2015. PMID: 25479231 Free PMC article.
-
Coding properties of spiking neurons: reverse and cross-correlations.Neural Netw. 2001 Jul-Sep;14(6-7):599-610. doi: 10.1016/s0893-6080(01)00053-3. Neural Netw. 2001. PMID: 11665756 Review.
-
A spiking neural network architecture for nonlinear function approximation.Neural Netw. 2001 Jul-Sep;14(6-7):933-9. doi: 10.1016/s0893-6080(01)00080-6. Neural Netw. 2001. PMID: 11665783 Review.
Cited by
-
A cognitive prosthesis for memory facilitation by closed-loop functional ensemble stimulation of hippocampal neurons in primate brain.Exp Neurol. 2017 Jan;287(Pt 4):452-460. doi: 10.1016/j.expneurol.2016.05.031. Epub 2016 May 24. Exp Neurol. 2017. PMID: 27233622 Free PMC article.
-
A nonlinear autoregressive Volterra model of the Hodgkin-Huxley equations.J Comput Neurosci. 2013 Feb;34(1):163-83. doi: 10.1007/s10827-012-0412-x. Epub 2012 Aug 10. J Comput Neurosci. 2013. PMID: 22878687
-
Nonlinear modeling of dynamic interactions within neuronal ensembles using Principal Dynamic Modes.J Comput Neurosci. 2013 Feb;34(1):73-87. doi: 10.1007/s10827-012-0407-7. Epub 2012 Jul 20. J Comput Neurosci. 2013. PMID: 23011343 Free PMC article.
-
Boolean modeling of neural systems with point-process inputs and outputs. Part II: Application to the rat hippocampus.Ann Biomed Eng. 2009 Aug;37(8):1668-82. doi: 10.1007/s10439-009-9716-z. Epub 2009 Jun 5. Ann Biomed Eng. 2009. PMID: 19499341 Free PMC article.
-
Design of optimal stimulation patterns for neuronal ensembles based on Volterra-type hierarchical modeling.J Neural Eng. 2012 Dec;9(6):066003. doi: 10.1088/1741-2560/9/6/066003. Epub 2012 Oct 17. J Neural Eng. 2012. PMID: 23075519 Free PMC article.
References
-
- Stark L. Neurological Control Systems: Studies in Bioengineering. New York: Plenum; 1968.
-
- Marmarelis PZ, Marmarelis VZ. Analysis of Physiological Systems: The White Noise Approach. New York: Plenum; 1978.
-
- Koch C, Segev I, editors. Methods in Neuronal Modeling: From Synapses to Networks. Cambridge, MA: MIT Press; 1989.
-
- Poznanski RR, editor. Modeling in the Neurosciences. Amsterdam, The Netherlands: Harwood Academic Publishers; 1999.
-
- Marmarelis VZ. Nonlinear Dynamic Modeling of Physiological Systems. Piscataway, NJ: Wiley-IEEE Press; 2004.
Publication types
MeSH terms
Grants and funding
LinkOut - more resources
Full Text Sources
Other Literature Sources

