. 2008 Aug 15;68(16):6652-60.
doi: 10.1158/0008-5472.CAN-08-1468.

Drug delivery with carbon nanotubes for in vivo cancer treatment

Affiliations

Drug delivery with carbon nanotubes for in vivo cancer treatment

Zhuang Liu et al. Cancer Res. .

Abstract

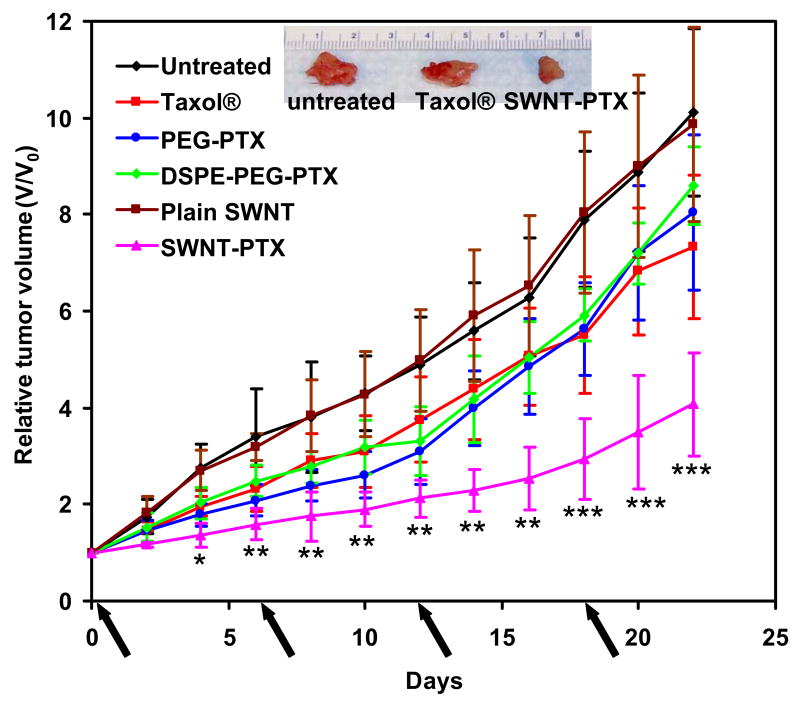
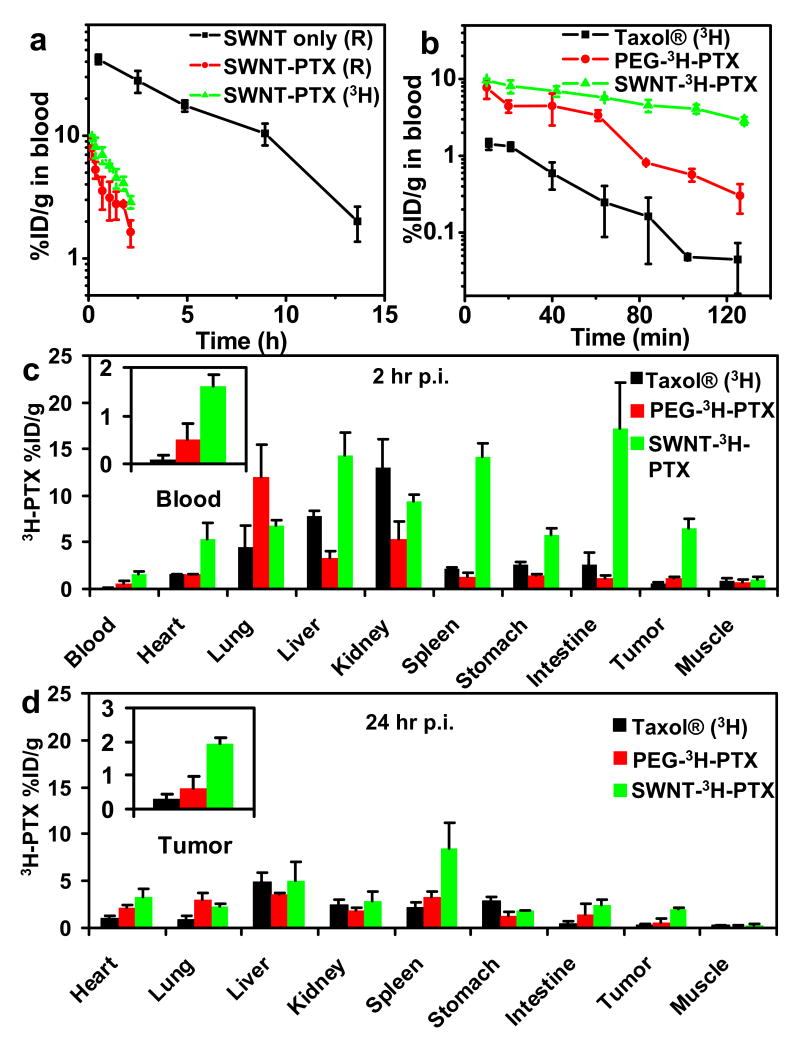
Chemically functionalized single-walled carbon nanotubes (SWNT) have shown promise in tumor-targeted accumulation in mice and exhibit biocompatibility, excretion, and little toxicity. Here, we show in vivo SWNT drug delivery for tumor suppression in mice. We conjugate paclitaxel (PTX), a widely used cancer chemotherapy drug, to branched polyethylene glycol chains on SWNTs via a cleavable ester bond to obtain a water-soluble SWNT-PTX conjugate. SWNT-PTX affords higher efficacy in suppressing tumor growth than clinical Taxol in a murine 4T1 breast cancer model, owing to prolonged blood circulation and 10-fold higher tumor PTX uptake by SWNT delivery likely through enhanced permeability and retention. Drug molecules carried into the reticuloendothelial system are released from SWNTs and excreted via biliary pathway without causing obvious toxic effects to normal organs. Thus, nanotube drug delivery is promising for high treatment efficacy and minimum side effects for future cancer therapy with low drug doses.


Figures

Figure 1
Figure 1
Carbon nanotube for paclitaxel delivery. a, schematic illustration of paclitaxel conjugation to SWNT functionalized by phospholipids with branched-PEG chains. The PTX molecules are reacted with succinic anhydride (at the circled OH site) to form cleavable ester bonds and linked to the termini of branched PEG, via amide bonds. This allows for releasing of PTX from nanotubes by ester cleavage in vivo. The SWNT-PTX conjugate is stably suspended in normal physiological buffer (PBS, as shown in the photo) and serum without aggregation. b, UV-VIS-NIR spectra of SWNT before (black curve) and after PTX conjugation (red). The absorbance peak of PTX at 230nm (green curve) was used to measure the PTX loading on nanotubes and the result was confirmed by radiolabel based assay. Excess un-conjugated PTX was removed by extensive filtration and washing. c, cell survival vs. concentration of PTX for 4T1 cells treated with Taxol®, PEG-PTX, DSEP-PEG-PTX or SWNT-PTX for 3 days. The PTX concentrations to cause 50% cell viability inhibition (IC50 values) were determined by sigmoidal fitting to be 16.4 ± 1.7 nM for Taxol®, 23.5 ± 1.1 nM for DSPE-PEG-PTX, 28.4 ± 3.4 nM for PEG-PTX and 13.4 ± 1.8 nM for SWNT-PTX. Error bars based on four parallel samples. Plain SWNTs (no PTX conjugated) are non-toxic (see supplementary Fig. S4)
Figure 2
Figure 2
Nanotube paclitaxel delivery suppresses tumor growth 4T1 breast cancer mice model. Tumor growth curves of 4T1 tumor bearing mice received different treatments indicated. The same PTX dose (5 mg/kg) was injected (on day 0, 6, 12 and 18, marked by arrows) for Taxol®, PEG-PTX, DSEP-PEG-PTX and SWNT-PTX. P values (Taxol® vs SWNT-PTX): * p<0.05, ** p<0.01, *** p<0.001. Number of mice used in experiments: 8 mice per group for untreated, 5 mice per group for SWNT only, 9 mice per group for Taxol®, 5 mice per group for PEG-PTX, 6 mice per group for DSEP-PEG-PTX, 14 mice per group for SWNT-PTX. Inset: a photo of representative tumors taken out of an untreated mouse (left), a Taxol® treated mouse (middle) and a SWNT-PTX treated mouse after sacrificing the mice at the end of the treatments.
Figure 3
Figure 3
Tumor staining for understanding of treatment effects. a, TUNEL (apoptosis assay) and DAPI (nuclear) co-staining images of 4T1 tumor slices from mice after different treatments indicated. While tumors from untreated mice (1st row), Taxol® treated mice (2nd row) and plain SWNT treated mice (3rd showed few apoptotic cells, many cells in the tumor from SWNT-PTX treated mice (4th row) were undergoing apoptosis. b, Ki67 (proliferation assay) and DAPI co-staining images of tumor slices from mice after various treatments. Few proliferation active cells were observed in the tumor received SWNT-PTX treatment (4th row). Tumors used in this study were taken from 4T1 tumor bearing mice 12 days post initiation of treatment. Scale bar: 100 μm.
Figure 4
Figure 4
Pharmacokinetics and biodistribution. a, blood circulation data of SWNT with and without PTX conjugation (marked as SWNT-PTX (R) and SWNT only (R) respectively) measured by Raman detection of SWNTs in blood samples (see Methods). Blood circulation data for SWNT-3HPTX (green curve) was also obtained by scintillation counting of 3H radioactivity in blood. Conjugation of PTX onto SWNTs greatly shortened circulation half life of SWNTs from 3.3 to 1.1 h. b, blood circulation data of 3H labeled Taxol®, PEG-PTX and SWNT-PTX measured by scintillation counting. SWNT-PTX exhibited significantly prolonged circulation half life (81.4 ± 7.4 min) than that of Taxol® (18.8 ± 1.5 min) and PEG-PTX (22.8 ± 1.0 min). c & d, 3H-PTX biodistribution in 4T1 tumor bearing mice injected with 3H labeled Taxol®, PEG-PTX and SWNT-PTX at (c) 2 h p.i. and (d) 24 h p.i. Inset in (c): 3H-PTX levels in the blood at 2 h p.i. Inset in (d): 3H-PTX levels in the tumor at 24 h p.i. The error bars were based on 3 mice per group in all graphs. 5mg/kg PTX dose was used in all cases.
Figure 5
Figure 5
SWNT biodistribution measured by Raman spectroscopy. a - c, comparison of 3H-PTX biodistribution and SWNT biodistribution in mice injected with SWNT-PTX(3H) at (a) 30 min, (b) 2 h and (c) 24 h p.i. SWNT biodistribution was measured by a Raman method (see Methods). The different biodistributions of PTX and SWNT carrier suggest rapid cleavage of ester bond for releasing of PTX from SWNTs in vivo. Error bars in all graphs were based on 3 mice per group. Insert in (c): a Raman image of the tumor slice. Strong SWNT G-band Raman signals at ∼1580cm-1 shift (green color corresponds to high G-band intensity) were observed in the tumor. Scale bar: 50 μm. d, confocal fluorescence images of tumor slices from mice injected with free AF488 dye (left) and AF488 labeled SWNT (SWNT-AF488, right). Tumor vasculature was stained by Cy3-anti-CD31. AF488 fluorescence (green color) and vasculature fluorescence (red color) were overlaid with optical images. Scale bar: 100μm.
Figure 6
Figure 6
Pilot toxicity study. a, body weight curves of mice received different treatments in the study (PTX dose∼5mg/kg). No obvious loss of body weight was observed in all the groups. 5-14 mice were used in each group (see details in Fig. 2 caption). b, blood chemistry data of untreated, Taxol® treated and SWNT-PTX treated mice. Specific attention was paid to those hepatic related serum chemistries (which would reflect liver damage or alternation of function) including aspartate aminotransferase (AST), alanine transaminase (ACT), alkaline phosphatase (Alk Phos) and gamma-glutamyl transpeptidase (GGT), without finding obvious abnormality for SWNT-PTX treated mice. The error bars are based on 3 mice in each group. c, hematoxylin & eosin (H&E) stained liver and spleen slices of mice. Although residues of carbon nanotubes were observed as black dots in the liver as pointed by the white arrow, no obvious damage was noticed in the liver and spleen of SWNT-PTX treated mice. Scale bar: 50 μm.

References

    1. Langer R. Drug delivery and targeting. Nature. 1998;392:5–10. - PubMed
    1. Moghimi SM, Hunter AC, Murray JC. Long-circulating and target-specific nanoparticles: theory to practice. Pharmacol Rev. 2001;53:283–318. - PubMed
    1. Maeda H, Wu J, Sawa T, Matsumura Y, Hori K. Tumor vascular permeability and the EPR effect in macromolecular therapeutics: a review. J Cont Rel. 2000;65:271–284. - PubMed
    1. Gao XH, Cui YY, Levenson RM, Chung LWK, Nie SM. In vivo cancer targeting and imaging with semiconductor quantum dots. Nat Biotechno. 2004;22:969–976. - PubMed
    1. Bartlett DW, Su H, Hildebrandt IJ, Weber WA, Davis ME. Impact of tumor-specific targeting on the biodistribution and efficacy of siRNA nanoparticles measured by multimodality in vivo imaging. Proc Natl Acad Sci U S A. 2007;104:15549–15554. - PMC - PubMed

Publication types

MeSH terms