. 2008 Aug 15;68(16):6779-88.
doi: 10.1158/0008-5472.CAN-08-0742.

Focal gains of VEGFA and molecular classification of hepatocellular carcinoma

Affiliations

Focal gains of VEGFA and molecular classification of hepatocellular carcinoma

Derek Y Chiang et al. Cancer Res. .

Abstract

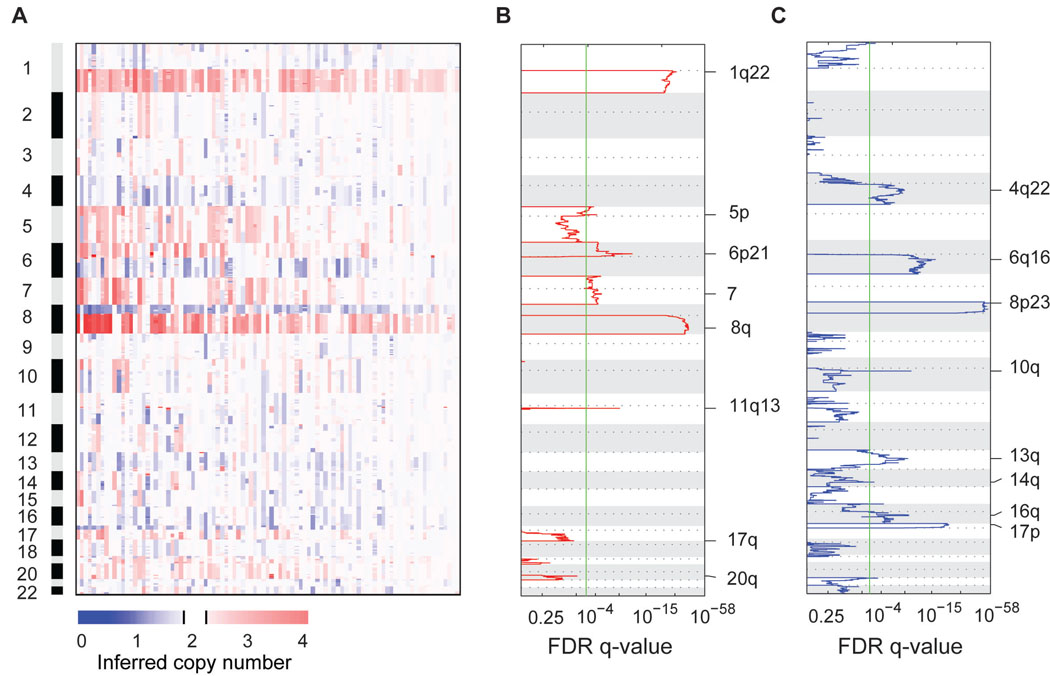
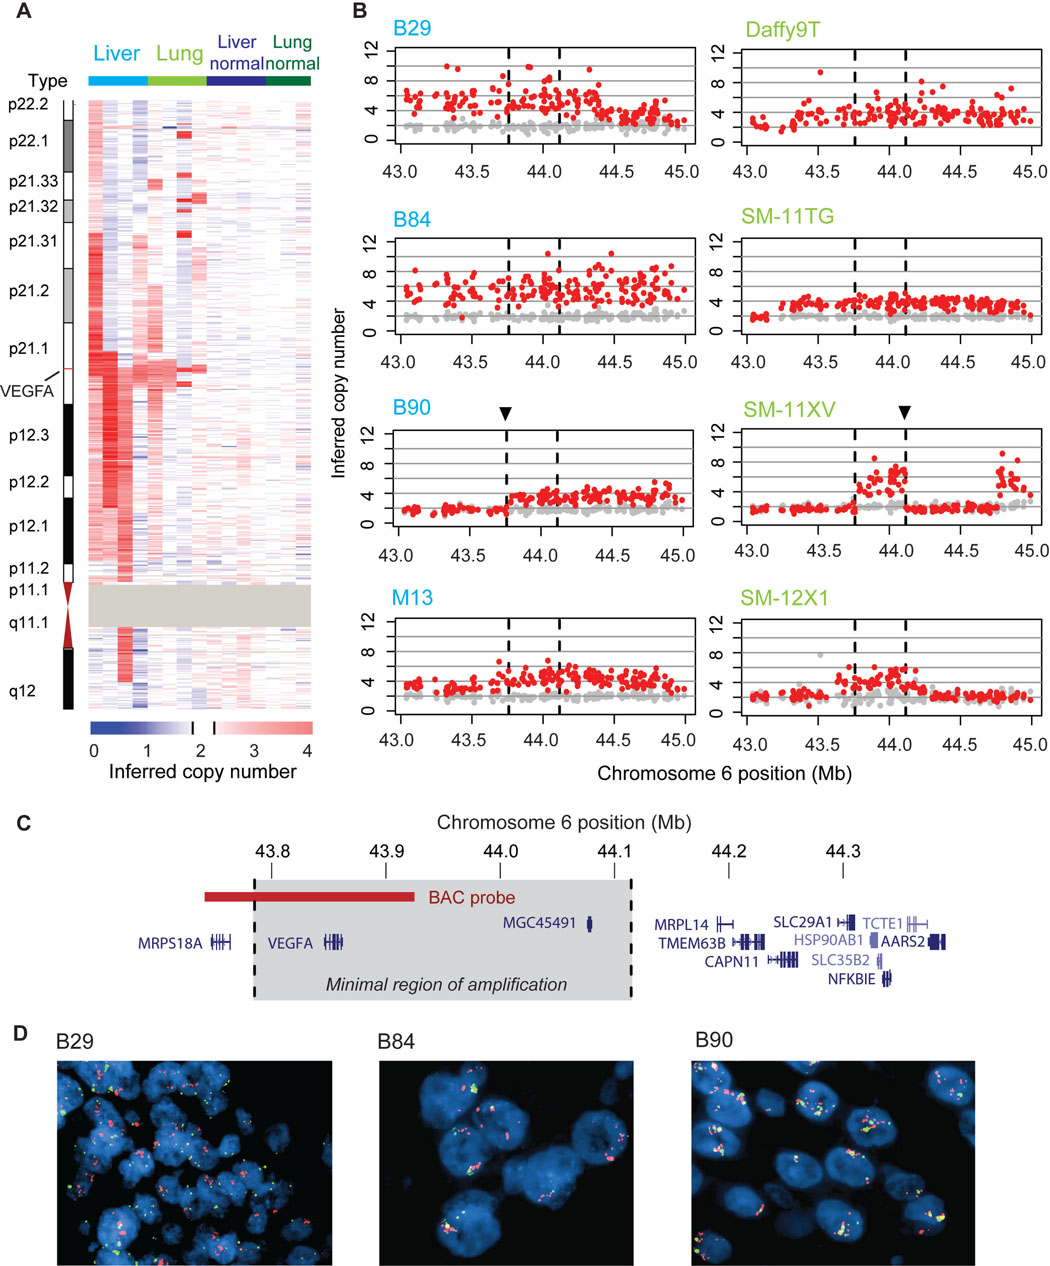
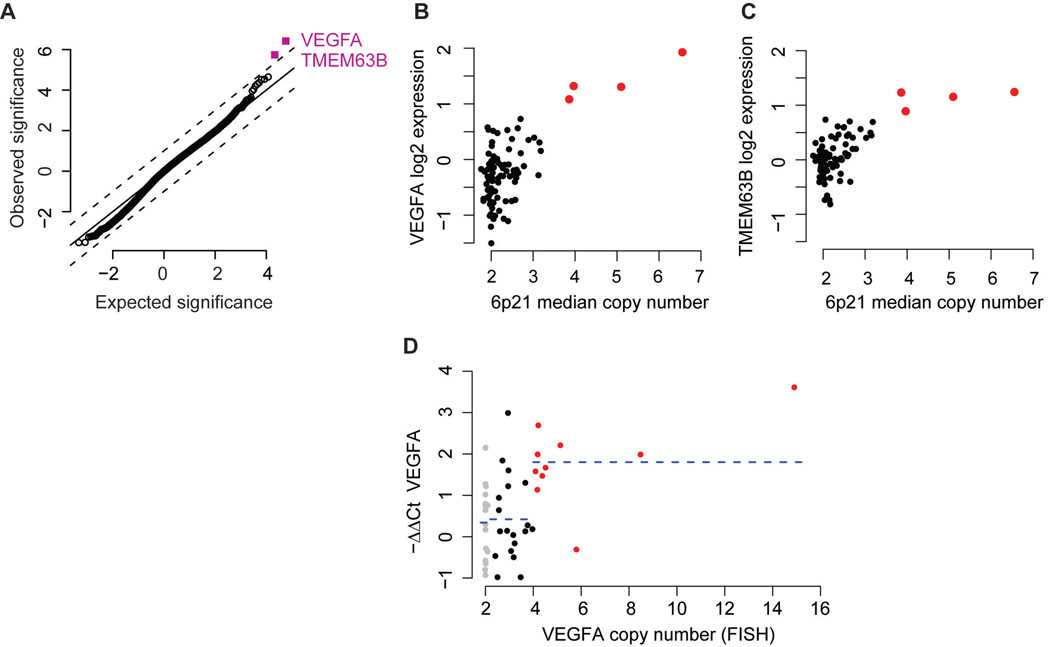
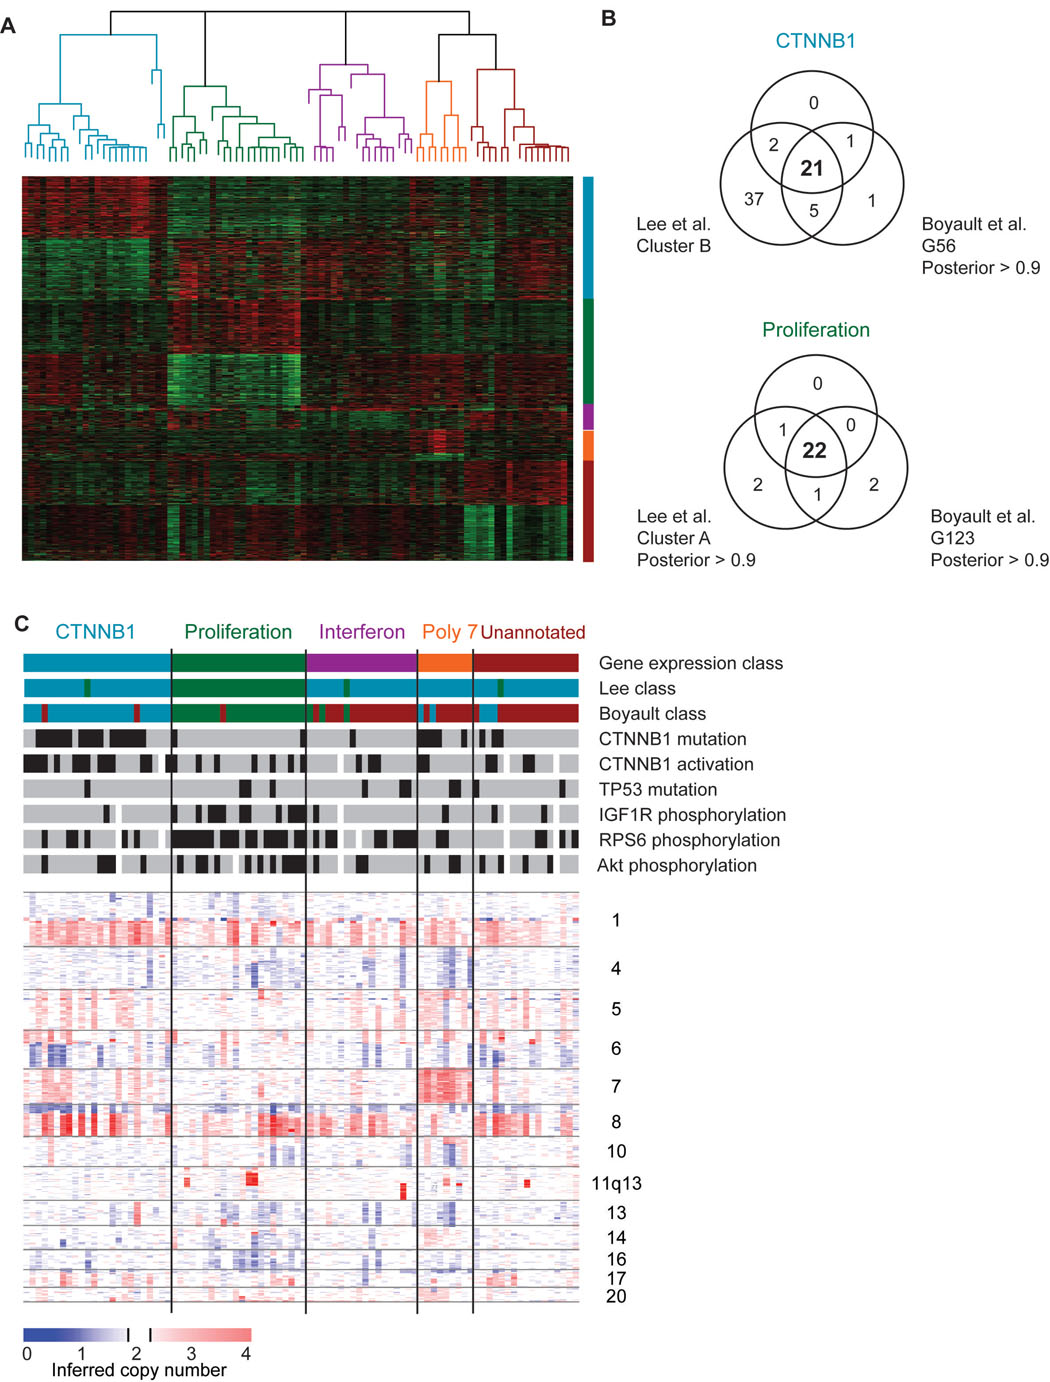
Hepatocellular carcinomas represent the third leading cause of cancer-related deaths worldwide. The vast majority of cases arise in the context of chronic liver injury due to hepatitis B virus or hepatitis C virus infection. To identify genetic mechanisms of hepatocarcinogenesis, we characterized copy number alterations and gene expression profiles from the same set of tumors associated with hepatitis C virus. Most tumors harbored 1q gain, 8q gain, or 8p loss, with occasional alterations in 13 additional chromosome arms. In addition to amplifications at 11q13 in 6 of 103 tumors, 4 tumors harbored focal gains at 6p21 incorporating vascular endothelial growth factor A (VEGFA). Fluorescence in situ hybridization on an independent validation set of 210 tumors found 6p21 high-level gains in 14 tumors, as well as 2 tumors with 6p21 amplifications. Strikingly, this locus overlapped with copy gains in 4 of 371 lung adenocarcinomas. Overexpression of VEGFA via 6p21 gain in hepatocellular carcinomas suggested a novel, non-cell-autonomous mechanism of oncogene activation. Hierarchical clustering of gene expression among 91 of these tumors identified five classes, including "CTNNB1", "proliferation", "IFN-related", a novel class defined by polysomy of chromosome 7, and an unannotated class. These class labels were further supported by molecular data; mutations in CTNNB1 were enriched in the "CTNNB1" class, whereas insulin-like growth factor I receptor and RPS6 phosphorylation were enriched in the "proliferation" class. The enrichment of signaling pathway alterations in gene expression classes provides insights on hepatocellular carcinoma pathogenesis. Furthermore, the prevalence of VEGFA high-level gains in multiple tumor types suggests indications for clinical trials of antiangiogenic therapies.


Conflict of interest statement

Conflicts of Interest

Please see Author Conflict of Interest forms for complete list. None of these companies had any role in the study design, data collection and analysis, decision to publish, or preparation of the manuscript.

Figures

Figure 1
Figure 1. Copy number alterations in hepatocellular carcinomas arising from hepatitis C viral infection
(A) Overview of chromosomal gains and losses in 103 hepatocellular carcinomas. Each tumor is displayed in a separate column, and inferred copy numbers at 238,304 loci are displayed from top to bottom in genomic order. Tumors are ordered from left to right according to the number of chromosome arms with significant copy number alterations. Copy number gains are shown in red and losses are shown in blue. (B) Recurrent chromosomal gains and (C) Recurrent chromosomal losses. The GISTIC algorithm identified significant regions of copy number alterations in multiple samples. Chromosomes are displayed in ascending order along the vertical axis. The horizontal axis indicates the statistical significance of recurrent gains or losses, corresponding to the False Discovery Rate q-value obtained from GISTIC. The vertical green line indicates a significance threshold of q < 0.001.
Figure 2
Figure 2. Overlapping high-level gains at 6p21 in hepatocellular carcinomas and lung adenocarcinomas
(A) Copy number alterations among 4 hepatocellular carcinomas (light blue), 4 lung adenocarcinomas (light green), 4 matched cirrhotic tissues from adjacent liver (dark blue), and 3 matched normals for the lung tumors (dark green). (B) Inferred copy numbers at individual single nucleotide polymorphism probe sets. Copy numbers are shown in red for tumor samples, or in grey for the matched normal from the same patient. Vertical dashed lines delineate the boundaries of the minimal overlapping region among the 8 tumors. (C) Annotated genes found in the minimal overlapping region at 6p21. Inclusion of the SM-11XV lung tumor narrows the overlapping region to the boundaries of the shaded box. The genomic location of BAC probe RP11-710L16 used for fluorescence in situ hybridization is indicated. (D) Confirmation of VEGFA copy gains by fluorescence in situ hybridization. Red signals indicate the BAC probe RP-710L16 centered on VEGFA, and green signals indicate BAC probe CEP-6 for the centromere of chromosome 6. Representative images are displayed for the 3 of 4 hepatocellular carcinomas with available tissue blocks, and detailed counts of probe signals are provided in Table S4.
Figure 3
Figure 3. High-level gains at 6p21 lead to VEGFA overexpression
(A) Significance Analysis of Microarrays identified overexpression of two genes among the 4 tumors with 6p21 amplifications. Each point represents the observed t-statistic, plotted against its expected score from permutation tests. The most significant gene is VEGFA, followed by TMEM63B (indicated in purple). The dashed lines indicate the confidence interval for the random, null distribution. (B) VEGFA or (C) TMEM63B is overexpressed in tumors with high-level gains of 6p21. Each of the 91 points represents the corresponding copy number and expression level for a single tumor. The horizontal axis indicates the median inferred copy number for 68 single nucleotide polymorphism probes in the minimal overlapping region at 6p21. The vertical axis indicates the log2 ratio between the expression level of each tumor, compared to the median of 10 normal liver samples on the Affymetrix U133 Plus 2 array. (D) Higher VEGFA expression is associated with increased copy numbers in an independent cohort. Each of the 45 points represents a single tumor chosen from the panel of 210 tumors evaluated by fluorescence in situ hybridization. The horizontal axis indicates the average number of VEGFA probes per nucleus. The vertical axis indicates the negative ΔΔCt values of VEGFA normalized to ACTB, compared to the median of 5 uninvolved, cirrhotic tissue samples. Tumors with more than 4 copies of VEGFA are shown in red (n = 10), tumors with gains of chromosome 6 are shown in black (n = 19), and diploid tumors are shown in grey (n = 16). The average negative ΔΔCt value for each of these three classes is plotted with a dashed blue line.
Figure 4
Figure 4. Integrated classification of genomic and molecular alterations in hepatocellular carcinomas
(A) Consensus hierarchical clustering of gene expression in 91 tumors. Colors in the sample dendrogram indicate the 5 gene expression classes determined by consensus hierarchical clustering over 32 different parameter set combinations. Rows display mean-centered expression levels for 1242 marker genes associated with each of the 5 gene expression classes. (B) Overlap of consensus classes with previously published classes. Class labels were assigned based on the distance to the closest shrunken centroid classifier for previous classifications (5, 7). (C) Copy number alterations among the gene expression classes. Gains and losses for the indicated chromosomes are displayed according to the color scheme in Figure 2. Mutation status (CTNNB1 exon 3 or TP53 exons 5 to 8) and immunohistochemical staining are indicated in greyscale: present (black); absent (grey); or missing data (white).

Similar articles

Cited by

References

    1. Thorgeirsson SS, Grisham JW. Molecular pathogenesis of human hepatocellular carcinoma. Nat Genet. 2002;31:339–346. - PubMed
    1. Farazi PA, DePinho RA. Hepatocellular carcinoma pathogenesis: from genes to environment. Nat Rev Cancer. 2006;6:674–687. - PubMed
    1. Chen X, Cheung ST, So S, et al. Gene expression patterns in human liver cancers. Mol Biol Cell. 2002;13:1929–1939. - PMC - PubMed
    1. Breuhahn K, Vreden S, Haddad R, et al. Molecular profiling of human hepatocellular carcinoma defines mutually exclusive interferon regulation and insulin-like growth factor II overexpression. Cancer Res. 2004;64:6058–6064. - PubMed
    1. Lee JS, Chu IS, Heo J, et al. Classification and prediction of survival in hepatocellular carcinoma by gene expression profiling. Hepatology. 2004;40:667–676. - PubMed

Publication types

MeSH terms

Substances