. 2008 Aug 15;68(16):6822-30.
doi: 10.1158/0008-5472.CAN-08-1332.

Stage-specific inhibitory effects and associated mechanisms of silibinin on tumor progression and metastasis in transgenic adenocarcinoma of the mouse prostate model

Affiliations

Stage-specific inhibitory effects and associated mechanisms of silibinin on tumor progression and metastasis in transgenic adenocarcinoma of the mouse prostate model

Komal Raina et al. Cancer Res. .

Abstract

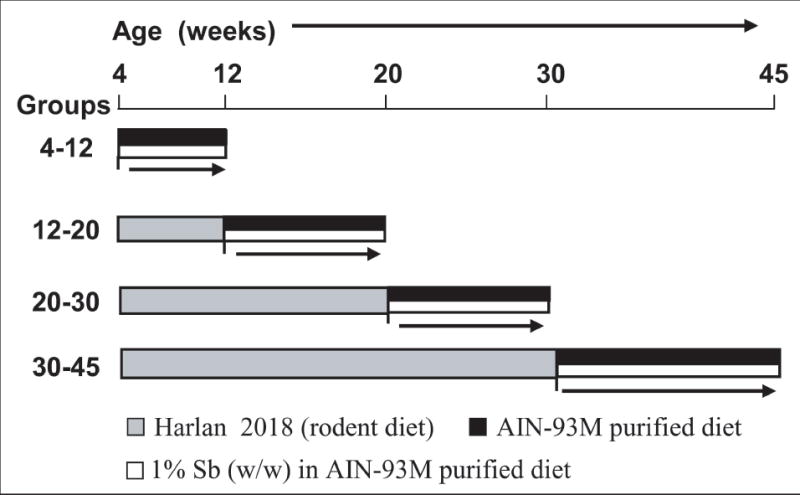
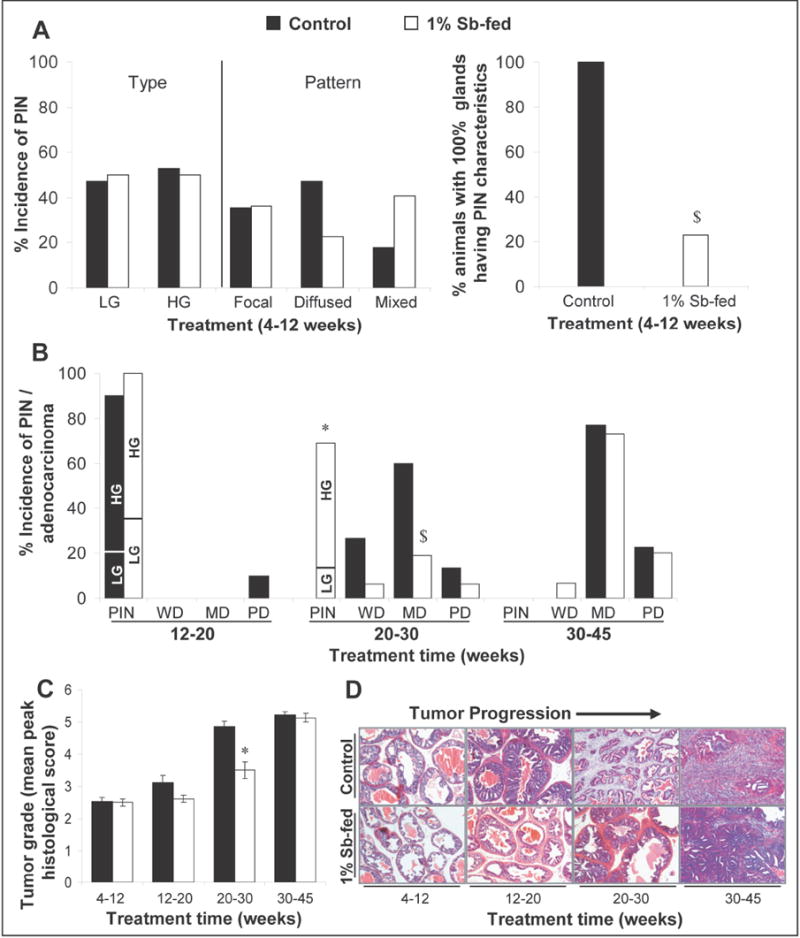
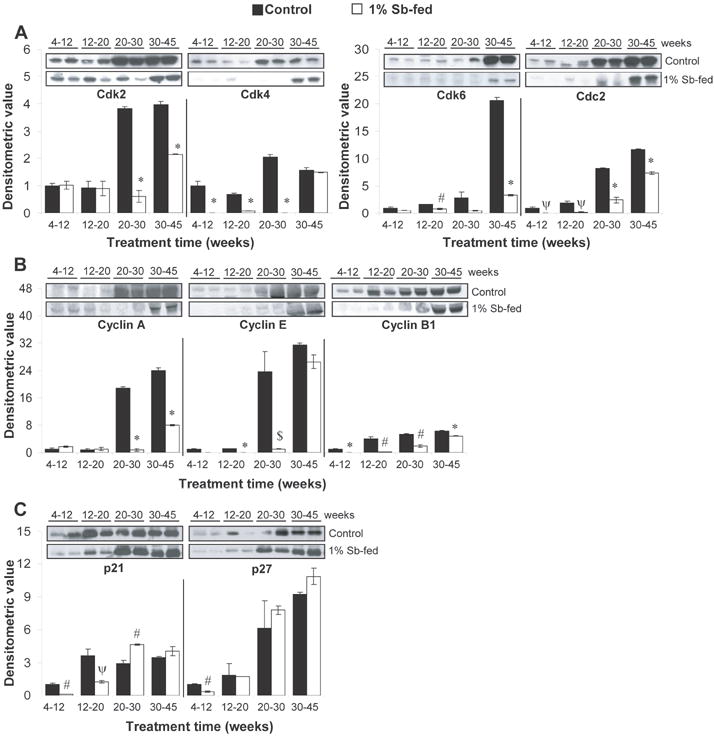
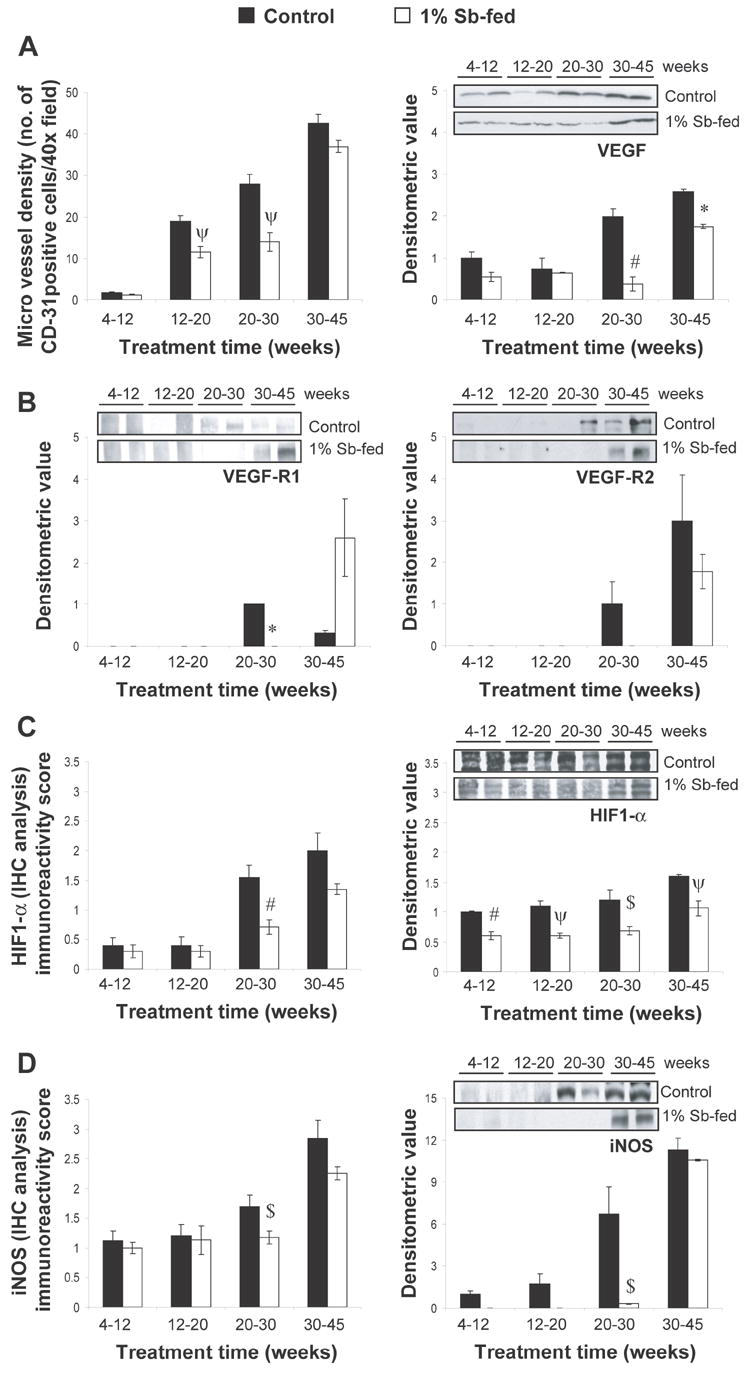
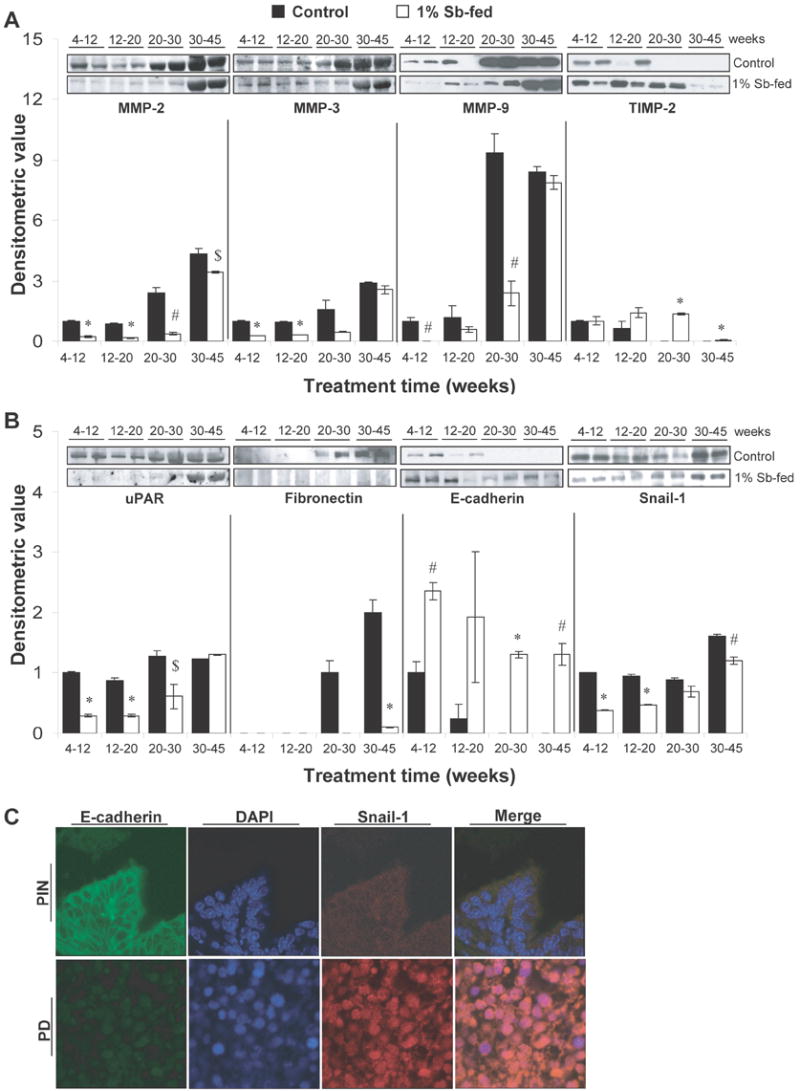
Herein, using transgenic adenocarcinoma of the mouse prostate (TRAMP) model, we assessed the "stage-specific" efficacy of silibinin feeding against prostate cancer (PCa) initiation, progression, angiogenesis and metastasis, and associated molecular events involved in silibinin effects during these stages. Male TRAMP mice starting at ages 4, 12, 20, and 30 weeks of age were fed with control or 1% silibinin-supplemented diet for 8 to 15 weeks in stage-specific manners. At the end of studies, silibinin-fed mice showed less severe prostatic lesions compared with positive controls. During early stages of prostate tumor development, silibinin mediated its efficacy mostly via antiproliferative mechanisms. Feeding of silibinin to animals burdened with higher stages of prostate tumor significantly decreased tumor grade via antiproliferative effect, and inhibition of angiogenesis as evidenced by decreased expressions of platelet endothelial cell adhesion molecule-1/CD-31, vascular endothelial growth factor, and associated receptor, vascular endothelial growth factor R2, hypoxia-inducible factor-1alpha, and inducible nitric oxide synthase. Metastasis to distant organs was decreased in silibinin-fed mice, which was associated with a decreased expression of matrix metalloproteinases, mesenchymal markers snail-1, and fibronectin in the prostatic tissue and retention of epithelial characteristics. Together, these findings are both novel and highly significant in establishing the dual efficacy of silibinin where it inhibits progression of primary prostatic tumor and also shows protective efficacy against angiogenesis and late stage metastasis. These effects of silibinin could have potential implications to improve the morbidity and survival in PCa patients.


Figures

Fig. 1
Fig. 1
Experimental design to study the stage specific effect of dietary silibinin feeding on prostate tumor progression, invasion, migration and metastasis in TRAMP mice. Male TRAMP mice starting at 4, 12, 20 and 30 weeks of age were fed with control or 1% silibinin-supplemented [1% silibinin (w/w) in AIN-93M purified] diet and then sacrificed at 12, 20, 30 and 45 weeks of age, respectively. The different groups depending upon their study period were referred to as the 4-12, 12-20, 20-30 and 30-45 week groups, respectively. Sb, silibinin.
Fig. 2
Fig. 2
Silibinin feeding inhibits neoplastic progression of prostate in TRAMP mice at various stages. In the experiment detailed in Fig.1, at the time of necropsy dorsolateral prostate glands were harvested and histopathologically analyzed for the different stages of the neoplastic progression. (A) Effect of silibinin feeding on the incidence and pattern of PIN lesions in the 4-12 week group of TRAMP mice. (B) Effect of silibinin on the incidence of PIN/adenocarcinoma of prostate in the 12-20, 20-30 and 30-45 week groups of TRAMP mice. Fisher’s Exact test was used to compare incidence of PIN and adenocarcinoma in positive control versus silibinin-fed groups. P values <0.05 were considered significant. *, P<0.001; $, P<0.05. (C) Silibinin feeding reduces the severity of prostatic lesions (tumor grade) of TRAMP prostate in a stage specific manner. Different stages of prostate tissues were graded as described in “Results”. The maximum histological score for the prostate lobe was used to calculate a mean for the treatment group. Data is presented as mean peak histological score and ± SEM (error bars) of each group. The difference between the positive controls versus the respective silibinin-fed group was analyzed by unpaired two-tailed Student’s t-test. P values <0.05 were considered significant. *, P<0.001. (D) The photomicrographs (×10 magnification) representative of the mean peak histological score of a treatment group show the H&E staining of the TRAMP prostate at different stages. Control, positive control (TRAMP mice); Sb, silibinin; PIN, prostate intraepithelial neoplasia; LG, low grade PIN; HG, high grade PIN; WD, well differentiated adenocarcinoma; MD, moderately differentiated adenocarcinoma; PD, poorly differentiated adenocarcinoma.
Fig. 3
Fig. 3
Stage specific effect of dietary feeding of silibinin on cell cycle regulatory molecules in the TRAMP prostate. (A-C) Silibinin feeding alters the expression levels of cell cycle regulatory molecules in the prostate of TRAMP mice in a stage specific manner. Randomly, four prostate tissue samples from individual mice were selected from each group for WB analyses detailed in “Materials and Methods”. Reactive protein bands for the expression of Cdk2, Cdk4, Cdk6, Cdc2, cyclin A, cyclin E, cyclin B1, Cip1/p21 and Kip1/p27 were visualized by enhanced chemiluminescence detection system, and membranes were stripped and probed with β-actin as loading control. Densitometric analysis of band intensity for each protein was adjusted with β-actin (blots not shown). The results were reported as mean and ± SEM (error bars) of the four bands from individual mouse prostate in each group based on the relative densities compared to the 4-12 positive control group. Representative blots of two prostate samples from each group are shown. Difference among the positive control groups was determined by one-way ANOVA followed by Tukey-test for multiple comparisons and values are mentioned only in the ‘Results section’. The difference between the positive controls versus the respective silibinin-fed group was analyzed by unpaired two-tailed Student’s t-test. P values <0.05 were considered significant. *, P<0.001; #, P<0.01; ψ P<0.02, $, P<0.05. Control, positive control (TRAMP mice); Sb, silibinin; PCNA, proliferation cell nuclear antigen; Cdk, cyclin-dependent kinase.
Fig. 4
Fig. 4
Stage specific effect of silibinin feeding on angiogenesis and pro-angiogenic markers in TRAMP prostate. (A, left) Effect of Silibinin feeding on intraductal MVD as inferred by IHC staining for the expression of PECAM-1/CD-31. IHC staining was based on DAB staining as detailed in “Materials and Methods”. Quantification of PECAM-1/CD-31-positive cells for determination of MVD is shown as mean and ± SEM (error bars) in each group. MVD was calculated as the number of positive cells × 100 / total number of cells counted under ×40 magnifications in 5 selected areas in each sample. (A, right) Stage specific effect of silibinin feeding on VEGF expression in TRAMP mice prostate as determined by WB analysis. (B) Stage specific effect of silibinin feeding on the expression levels of VEGF-R1 and VEGF-R2 in TRAMP mice prostate as determined by WB analysis. (C-D) Stage specific effect of silibinin feeding on the expression levels of HIF-1α and iNOS in TRAMP mice prostate as determined by IHC/WB analysis. Randomly, four prostate tissue samples from individual mice were selected from each group for WB analysis as detailed in “Materials and Methods”. Reactive protein bands were visualized by enhanced chemiluminescence detection system, and membrane were stripped and probed with β-actin as loading control. Densitometric analysis of band intensity for each protein was adjusted with β-actin (blots not shown). The results were reported as mean and ± SEM (error bars) of the four bands from individual mouse prostate in each group based on the relative densities compared to the 4-12 positive control group. Representative blots of two prostate samples from each group are shown. Difference between the positive control groups was determined by one-way ANOVA followed by Tukey-test for multiple comparisons, and values are mentioned only in the “Results section”. The difference between the positive controls versus the respective silibinin-fed group was analyzed by unpaired two-tailed Student’s t-test. P values <0.05 were considered significant. *, P<0.001; #, P<0.01; ψ P<0.02, $, P<0.05. Control, positive control (TRAMP mice); Sb, silibinin; MVD, microvessel density; platelet endothelial cell adhesion molecule-1 (PECAM-1/CD-31); VEGF, vascular endothelial growth factor; VEGF-R1, VEGF receptor-1; VEGF-R2, VEGF receptor-2; HIF-1α , hypoxia-inducible factor-1α; iNOS, inducible nitric oxide synthase; WB, western blot; IHC, immunohistochemical.
Fig. 5
Fig. 5
Stage specific effect of silibinin feeding on prostate tumor invasion, migration and epithelial mesenchymal transition in TRAMP prostate. (A-B) Reactive protein bands for the expression of MMP-2, 3, 9; TIMP-2; uPAR; fibronectin, E-cadherin and snail-1 were visualized by enhanced chemiluminescence detection system. Randomly, four prostate tissue samples from individual mice were selected from each group for WB analysis as detailed in “Materials and Methods”. Reactive protein bands were visualized by enhanced chemiluminescence detection system, and membrane were stripped and probed with β-actin as loading control. Densitometric analysis of band intensity for each protein was adjusted with β-actin (blots not shown). The results were reported as mean and ± SEM (error bars) of the four bands from individual mouse prostate in each group based on the relative densities compared to the 4-12 positive control group. Representative blots of two prostate samples from each group are shown. Difference between the positive control groups was determined by one-way ANOVA followed by Tukey-test for multiple comparisons, and values are mentioned only in the ‘Results section’. The difference between the positive controls versus the respective silibinin-fed group was analyzed by unpaired two-tailed Student’s t-test. P values <0.05 were considered significant. *, P<0.001; #, P<0.01; $, P<0.05. Control, positive control (TRAMP mice); Sb, silibinin; MMP, matrix metalloproteinase; TIMP, tissue inhibitor of MMP; uPAR, urokinase–type plasminogen; receptor. (C) IF localization studies to determine the correlation of E-cadherin and snail expression in prostatic tissue. Prostatic tissue was double stained for E-cadherin (green) and snail-1 (red) expression. Nuclear staining was done with DAPI (blue). Photomicrographs (×100 magnification). IF, Immunofluorescence; PIN, prostate intraepithelial neoplasia; PD, poorly differentiated adenocarcinoma.

Similar articles

Cited by

References

    1. Stewart AB, Lwaleed BA, Douglas DA, Birch BR. Current drug therapy for prostate cancer: an overview. Curr Med Chem Anticancer Agents. 2005;5:603–12. - PubMed
    1. Brand TC, Canby-Hagino ED, Pratap Kumar A, et al. Chemoprevention of prostate cancer. Hematol Oncol Clin North Am. 2006;20:831–43. - PubMed
    1. Klein EA. Chemoprevention of prostate cancer. Annu Rev Med. 2006;57:49–63. - PubMed
    1. Singh RP, Agarwal R. Mechanisms of action of novel agents for prostate cancer chemoprevention. Endocr Relat Cancer. 2006;13:751–78. - PubMed
    1. Thompson IM. Chemoprevention of prostate cancer: agents and study designs. J Urol. 2007;178:S9–S13. - PubMed

Publication types

MeSH terms