. 2008 Oct;148(2):1117-27.
doi: 10.1104/pp.108.124271. Epub 2008 Aug 13.

Combined genetic and modeling approaches reveal that epidermal cell area and number in leaves are controlled by leaf and plant developmental processes in Arabidopsis

Affiliations

Combined genetic and modeling approaches reveal that epidermal cell area and number in leaves are controlled by leaf and plant developmental processes in Arabidopsis

Sébastien Tisné et al. Plant Physiol. 2008 Oct.

Abstract

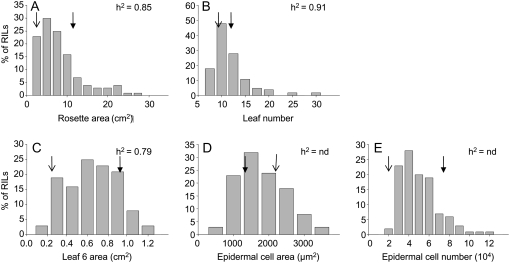
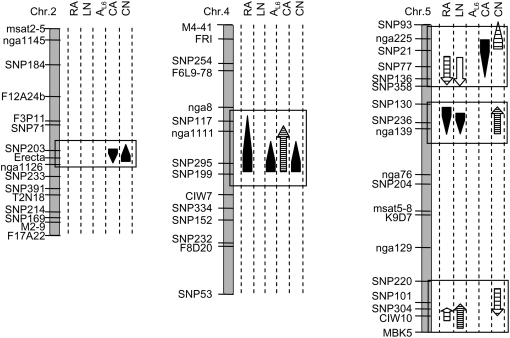
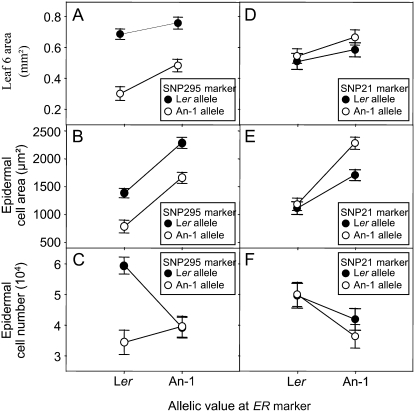
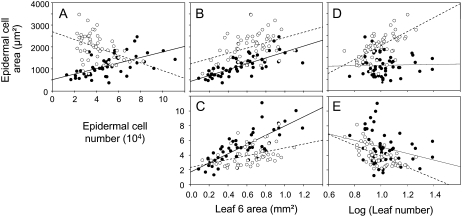
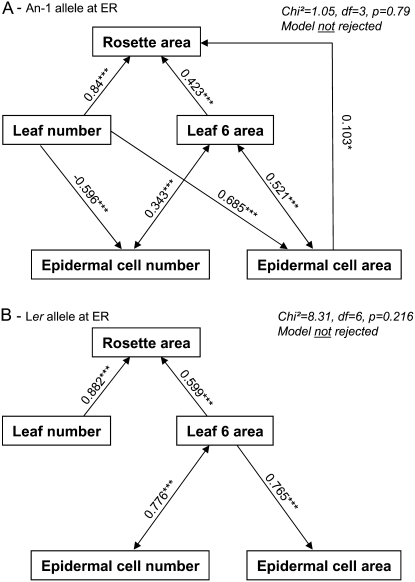
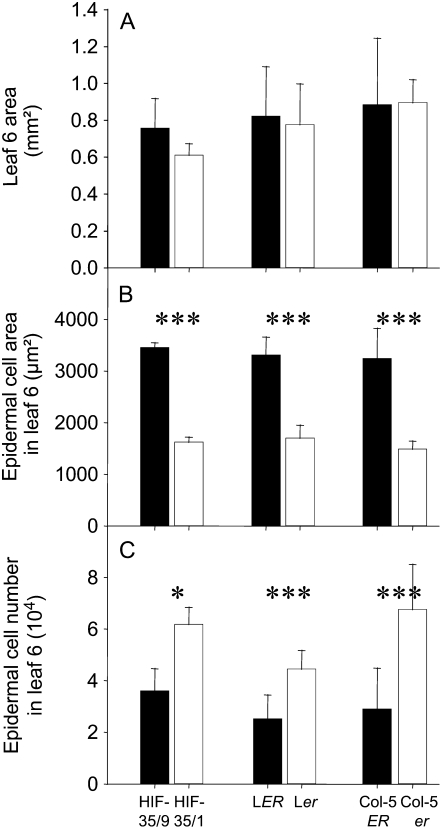
Both leaf production and leaf expansion are tightly linked to cell expansion and cell division, but the functional relationships between all these variables are not clearly established. To get insight into these relationships, a quantitative genetic analysis was performed in 118 recombinant inbred lines derived from a cross between the Landsberg erecta and Antwerp accessions and was combined with a structural equation modeling approach. Main effects and epistatic interactions at the quantitative trait locus (QTL) level were detected for rosette area, rosette leaf number, leaf 6 area, epidermal cell area and number. A QTL at ERECTA marker (ER) controlled cell expansion and cell division, in interaction with two other QTLs at SNP295 and SNP21 markers. Moreover, both the screening for marker association involved in the variation of the relationships between leaf growth variables and the test of alternative functional models by structural equation modeling revealed that the allelic value at ER controlled epidermal cell area and epidermal cell number in a leaf. These effects are driven both by a whole plant mechanism associated with leaf production and by a single leaf mechanism associated with leaf expansion. The complex effects of the QTL at ER were validated in selected heterogeneous inbred families. The ERECTA gene, which is mutated in the Landsberg erecta parental line, was found to be a putative candidate responsible for these mapped effects by phenotyping mutants of this gene at the cellular level. Together, these results give insight into the complex determination of leaf epidermal cell number and area.


Figures

Figure 1.
Figure 1.
Frequency distribution of five leaf growth variables in the Ler × An-1 population. Growth variables are rosette area (A); leaf number (B); leaf 6 area (C); epidermal cell area in leaf 6 (D); and epidermal cell number in leaf 6 (E). Broad sense heritabilities are given in the top right corner of each image when they could be calculated (h2) and are denoted by “nd” otherwise (n = 4). Mean values of each variable for the two parental lines are shown by open and closed arrows on corresponding images for An-1 and Ler, respectively (n = 8).
Figure 2.
Figure 2.
The Ler × An-1 linkage map showing QTLs for the five leaf growth variables: rosette area (RA), leaf number (LN), leaf 6 area (AL6), epidermal cell area in leaf 6 (CA), and epidermal cell number in leaf 6 (CN). Only groups of colocalization of QTLs with at least one of the cellular leaf growth variables are shown. For the complete set of detected QTLs, see Table III. QTLs are represented by arrows and the lengths of the arrows indicate the 2-LOD support intervals. The direction of arrowheads indicates the sign of the additive effect: Arrows pointing upward indicate that Ler alleles have a positive effect. The shape of the arrow indicates the nature of the QTL: main effects (headed arrows); in epistatic interactions (nonheaded arrows). The grayscale of the arrows indicates the percentage of phenotypic variance explained by the QTL, respectively, 0% to 10%, 10% to 25%, 25% to 50%, and 50% to 100% from the whitest to the darkest.
Figure 3.
Figure 3.
Allelic values for leaf 6 area, epidermal cell area, and epidermal cell number in leaf 6 at ER and SNP295 markers (A–C, respectively) and at ER and SNP21 markers (D–F, respectively) identified in epistatic interaction. Vertical bars are ses.
Figure 4.
Figure 4.
Relationships between epidermal cell area and epidermal cell number in leaf 6 (A); epidermal cell area in leaf 6 and leaf 6 area (B); epidermal cell number in leaf 6 and leaf 6 area (C); epidermal cell area in leaf 6 and leaf number (D); and epidermal cell number in leaf 6 and leaf number in two subpopulations from the Ler × An-1 population (E): for all RILs with the Ler allele at ER (n = 58; black circles) and for RILs with the An-1 allele at ER (n = 57; white circles).
Figure 5.
Figure 5.
Two path diagrams tested in each subpopulation from the Ler × An-1 population: for all RILs with the An-1 allele at ER (A) and for RILs with the Ler allele at ER (B). Arrows represent linear functional relations between leaf growth variables. Single-headed arrows represent causal relationships and double-headed arrows represent free correlations. Standardized path coefficients are indicated on each arrow with level of significance (***, P < 0.001; *, P < 0.05). Both models were tested against our data and results are given in the top right corner.
Figure 6.
Figure 6.
Leaf 6 area (A), epidermal cell area in leaf 6 (B), and epidermal cell number in leaf 6 (C) measured in six genotypes: HIF-35/9 (n = 5) and HIF-35/1 (n = 5), LER (n = 10) and Ler (n = 10), Col-5ER (n = 10) and Col-5er (n = 10). Vertical bars are sds. *, **, and ***, Significant difference between the two lines with P values <0.05, <0.01, and <0.001, respectively.

References

    1. Aguirrezabal L, Bouchier-Combaud S, Radziejwoski A, Dauzat M, Cookson SJ, Granier C (2006) Plasticity to soil water deficit in Arabidopsis thaliana: dissection of leaf development into underlying growth dynamic and cellular variables reveals invisible phenotypes. Plant Cell Environ 29 2216–2227 - PubMed
    1. Ashby E (1948) Studies in the morphogenesis of leaves. 2. The area, cell size and cell number of leaves of Ipomoea in relation to their position on the shoot. New Phytol 47 177–195
    1. Berná G, Robles P, Micol JL (1999) A mutational analysis of leaf morphogenesis in Arabidopsis thaliana. Genetics 152 729–742 - PMC - PubMed
    1. Boyes DC, Zayed MA, Ascenzi R, McCaskill AJ, Hoffman NE, Davis KR, Görlach J (2001) Growth stage–based phenotypic analysis of Arabidopsis a model for high throughput functional genomics in plants. Plant Cell 13 1499–1510 - PMC - PubMed
    1. Chase K, Adler FR, Lark KG (1997) Epistat: a computer program for identifying and testing interactions between pairs of quantitative trait loci. Theor Appl Genet 94 724–730

Publication types

MeSH terms

LinkOut - more resources