. 2008 Oct;19(10):4404-20.
doi: 10.1091/mbc.e08-02-0188. Epub 2008 Aug 13.

Calnexin is involved in apoptosis induced by endoplasmic reticulum stress in the fission yeast

Affiliations

Calnexin is involved in apoptosis induced by endoplasmic reticulum stress in the fission yeast

Renée Guérin et al. Mol Biol Cell. 2008 Oct.

Abstract

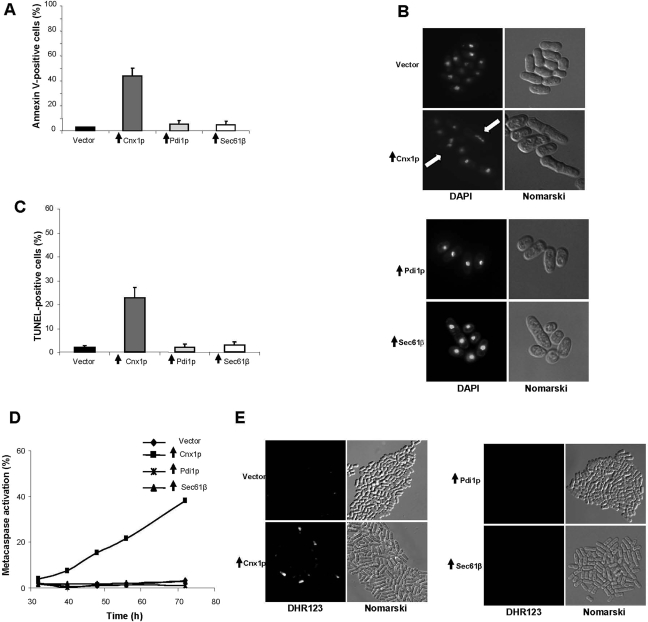
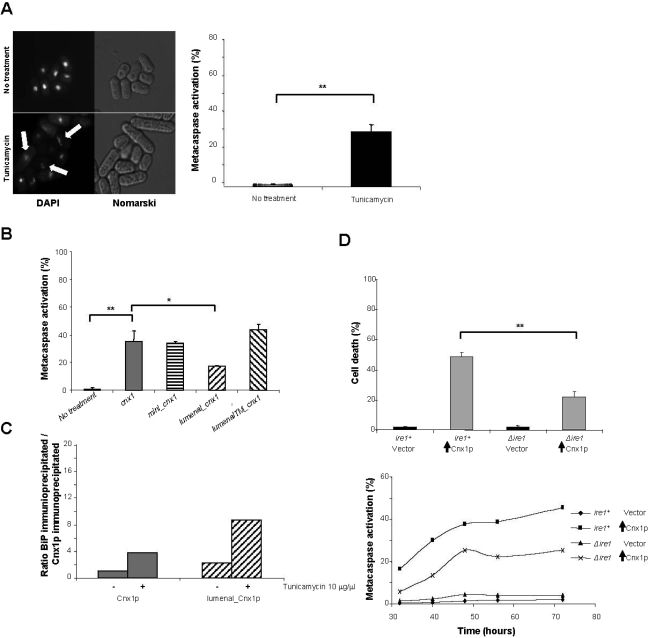
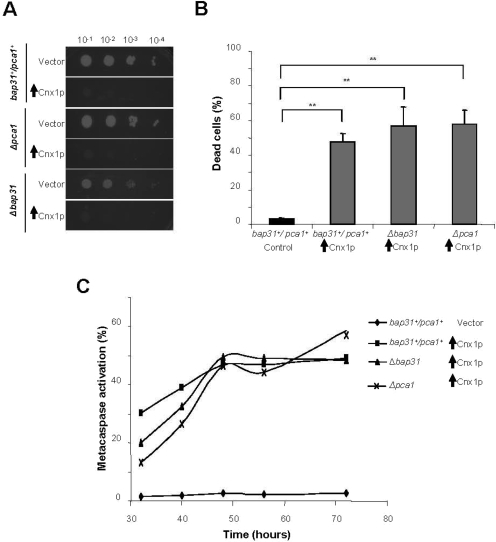
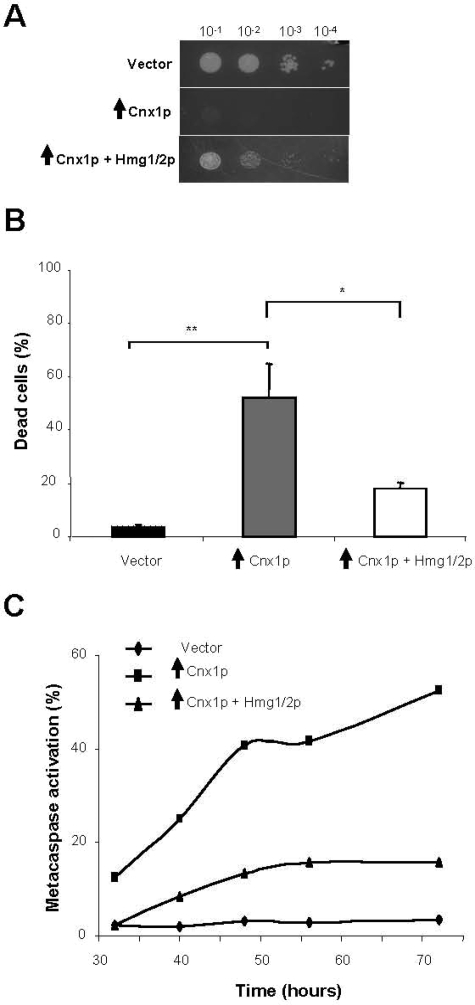
Stress conditions affecting the functions of the endoplasmic reticulum (ER) cause the accumulation of unfolded proteins. ER stress is counteracted by the unfolded-protein response (UPR). However, under prolonged stress the UPR initiates a proapoptotic response. Mounting evidence indicate that the ER chaperone calnexin is involved in apoptosis caused by ER stress. Here, we report that overexpression of calnexin in Schizosaccharomyces pombe induces cell death with apoptosis markers. Cell death was partially dependent on the Ire1p ER-stress transducer. Apoptotic death caused by calnexin overexpression required its transmembrane domain (TM), and involved sequences on either side of the ER membrane. Apoptotic death caused by tunicamycin was dramatically reduced in a strain expressing endogenous levels of calnexin lacking its TM and cytosolic tail. This demonstrates the involvement of calnexin in apoptosis triggered by ER stress. A genetic screen identified the S. pombe homologue of the human antiapoptotic protein HMGB1 as a suppressor of apoptotic death due to calnexin overexpression. Remarkably, overexpression of human calnexin in S. pombe also provoked apoptotic death. Our results argue for the conservation of the role of calnexin in apoptosis triggered by ER stress, and validate S. pombe as a model to elucidate the mechanisms of calnexin-mediated cell death.


Figures

Figure 1.
Figure 1.
Overexpression of cnx1+ induces cell death. (A) Schematic representation of S. pombe calnexin, Cnx1p. SP corresponds to the signal peptide (22 amino acids; aa), followed by the N-terminal part (98 aa; symbolized by the forward-hatched box). The highly conserved central domain (hcd) is represented by a white box (317 aa). The C-terminal part of lumenal domain of calnexin is 52-aa long and is represented by the backward-hatched box. The transmembrane domain (TM, black box) and the cytosolic tail (punctuated box) span 23 and 48 aa, respectively. (B) Survival of cells overexpressing Cnx1p (strain SP8007R) and control strains (empty vector, SP7975R; Pdi1p, SP16058; and Sec61β, SP15302) was assayed by serial dilution on inducing plates (without thiamine) or repressing plates (with thiamine). Samples of 10 μl of four 10-fold serial dilutions (10−1–10−4) of cells at 0.5 OD595 were spotted on selective MM and incubated at 30°C for 7 d (see Materials and Methods). (C) Percentage of dead cells measured by staining with fluorescent vital dye Phloxin B. Cells overexpressing Cnx1p (strain SP8007R) and control strains (empty vector, SP7975R; Pdi1p, SP16058; and Sec61β, SP15302) were stained with Phloxin B after 48 h of induction of overexpression and fluorescent cells were quantified by FACS. Stained cells were considered as dead. A global ANOVA showed that the values obtained among the strains were significantly different (p = 0.000). In C, vertical black arrows symbolize overexpression of the indicated protein.
Figure 2.
Figure 2.
The overexpression of calnexin induces typical apoptotic phenotypes. (A) Phosphatidyl serine externalization. The Annexin V assay was carried out after 48 h of induction of overexpression for the Cnx1p (strain SP8007R) and control strains (empty vector, SP7975R; Pdi1p, SP16058; and Sec61β, SP15302). The percentage of stained cells was measured by FACS. A global ANOVA showed that the values obtained among the strains were significantly different (p = 0.000). (B) Nuclear fragmentation. Cells overexpressing Cnx1p (strain SP8007R) and control strains (empty vector, SP7975R; Pdi1p, SP16058; and Sec61β, SP15302) were stained with DAPI, after 96 h of induction of overexpression. Cells were visualized under fluorescence microscopy; Nomarski fields are shown. White arrows indicate fragmented nuclei. (C) DNA fragmentation. The TUNEL assay was carried out after 96 h of induction of overexpression for the Cnx1p (strain SP8007R) and control strains (empty vector, SP7975R; Pdi1p, SP16058; and Sec61β, SP15302). The percentage of stained cells was measured by FACS. A global ANOVA showed that the values obtained among the strains were significantly different (p = 0.000). (D) Metacaspase activation. The fluorescent probe FITC-VAD-FMK was used to measure metacaspase activation by FACS, at different time points after the overexpression of Cnx1p (strain SP8007R) and control strains (empty vector, SP7975R; Pdi1p, SP16058; and Sec61β, SP15302), as described in the Materials and Methods. The experiment was repeated three times, and this graph is a representation of a typical experiment. (E) Accumulation of ROS. ROS accumulation in the Cnx1p overexpressing strain (SP8007R) and control strains (empty vector, SP7975R; Pdi1p, SP16058; and Sec61β, SP15302) was determined by using the ROS probe DHR123 and fluorescence microscopy. In this figure, vertical black arrows symbolize overexpression of the indicated protein.
Figure 3.
Figure 3.
The transmembrane domain (TM) is required to induce cell death by overexpression of calnexin. (A) Structures of calnexin mutants used in this study. Four different mutants were used. The mutant lumenal_Cnx1p encodes the lumenal domain of calnexin (415 aa) and is truncated of the TM and the cytosolic tail. The mutant mini_Cnx1p encodes 123 residues corresponding to last 52 aa at the C-terminal end of the lumenal domain, the TM (23 aa), and the cytosolic tail (48 aa). The lumenalTM_Cnx1p mutant spans the lumenal domain and the TM of calnexin (437 aa). The C-termTM_Cnx1p_cmyc mutant encodes the TM and the cytosolic of calnexin (71 aa) and encodes also the c-myc tag for immunodetection. For the sake of simplicity, the SP of calnexin is not represented in this figure. The capacity of the mutants to sustain the viability of the cells in a Δcnx1 background is indicated at the right of the figure by + or − signs and was determined by a plasmid-shuffling experiment (see Materials and Methods and Elagoz et al., 1999). (B) Immunoblot detection of Cnx1p and mutants of calnexin. Samples corresponding to 10 μg of protein extracts from cells overexpressing mini_Cnx1p (strain SP7965R) and C-termTM_Cnx1p_cmyc (strain SP8125R) and 2 μg from cells overexpressing lumenal_Cnx1p (strain SP16053) and lumenalTM_Cnx1p (strain SP8056) were loaded on a 12% (wt/vol) SDS-PAGE gel. Calnexin proteins were detected by immunoblotting with the anti-Cnx1p rabbit polyclonal serum (1:30,000) for Cnx1p, mini_Cnx1p, lumenal_Cnx1p, and lumenalTM_Cnx1p mutants and with the 9E10 anti-cmyc mouse mAb (1:500) for C-termTM_Cnx1p_cmyc mutant. The positions of the molecular mass markers (in kDa) are indicated on the left. The bands corresponding to the overexpressed are identified with a asterisk (*). The band marked with a black circle (●) corresponds to the endogenous calnexin present in all the strains but that is visible only in the mini_Cnx1p well due to the amount of proteins loaded. (C) Survival of cells overexpressing Cnx1p (strain SP8007R), the mutants of calnexin (mini_Cnx1p, SP7965R; lumenal_Cnx1p, SP16053; lumenalTM_Cnx1p, SP8056R; C-termTM_Cnx1p_cmyc, SP8125R) and the control strain (empty vector, SP7975R) was assayed by serial dilution on inducing plates (without thiamine) and repressing plates (with thiamine). Samples of 10 μl of four 10-fold serial dilutions (10−1–10−4) of cells at 0.5 OD595 were spotted on selective MM and incubated at 30°C for 7 d (see Materials and Methods). (D) Percentage of dead cells measured by staining with fluorescent vital dye Phloxin B. Cells overexpressing Cnx1p (strain SP8007R), the mutants of calnexin (mini_Cnx1p, SP7965R; lumenal_Cnx1p, SP16053; lumenalTM_Cnx1p, SP8056R; C-termTM_Cnx1p_cmyc, SP8125R) and the control strain (empty vector, SP7975R) were stained with Phloxin B after 48 h of induction of overexpression, and fluorescent cells were quantified by FACS. Stained cells were considered as dead. A global ANOVA showed that the values obtained among the strains were significantly different (p = 0.000). The significance of differences in the results was evaluated by a Student's t test, pairwise calculated with respect to the control for Cnx1p and C-termTM_Cnx1p_cmyc and to Cnx1p for the calnexin mutants. **p < 0.01 and *p < 0.05.
Figure 4.
Figure 4.
The TM of calnexin is required for induction of apoptotic cell death due to overexpression. (A) Nuclear fragmentation. Cells overexpressing the mutants of calnexin (mini_Cnx1p, SP7965R; lumenal_Cnx1p, SP16053; lumenalTM_Cnx1p, SP8056R; C-termTM_Cnx1p_cmyc, SP8125R) and the control strain (empty vector, SP7975R) were stained with DAPI, after 96 h of induction of overexpression. Cells were visualized under fluorescence microscopy; Nomarski fields are shown. White arrows indicate fragmented nuclei. (B) DNA fragmentation. The TUNEL assay was carried out after 96 h of induction of overexpression for the Cnx1p (strain SP8007R), the mutants of calnexin (mini_Cnx1p, SP7965R; lumenal_Cnx1p, SP16053; lumenalTM_Cnx1p, SP8056R; C-termTM_Cnx1p_cmyc, SP8125R) and the control strain (empty vector, SP7975R). The percentage of stained cells was measured by FACS. A global ANOVA showed that the values obtained among the strains were significantly different (p = 0.000). The significance of differences in the results was evaluated by a Student's t test, pairwise calculated with respect to the control for Cnx1p and C-termTM_Cnx1p_cmcyc and to Cnx1p for the calnexin mutants. **p < 0.01 and *p < 0.05. (C) Metacaspase activation. The fluorescent probe FITC-VAD-FMK was used to measure metacaspase activation by FACS, at different time points after the overexpression of Cnx1p (strain SP8007R), the mutants of calnexin (mini_Cnx1p, SP7965R; lumenal_ Cnx1p, SP16053; lumenalTM_Cnx1p, SP8056R; C-termTM_Cnx1p_cmyc, SP8125R) and the control strain (empty vector, SP7975R) as described in the Materials and Methods. The experiment was repeated three times, and this graph is a representation of a typical experiment. In this figure, vertical black arrows symbolize overexpression of the indicated protein.
Figure 5.
Figure 5.
Involvement of calnexin in ER-mediated apoptosis in S. pombe. (A) Tunicamycin induces apoptotic cell death in S. pombe. S. pombe cells carrying a wild-type genomic copy of calnexin (strain SP556) were treated with 5 μg/ml tunicamycin or with the solvent (no treatment) and subsequently stained with DAPI to detect nuclear fragmentation and with FITC-VAD-FMK to determine the % of metacaspase activation. For DAPI staining, cells were examined by fluorescence microscopy. White arrows indicate fragmented nuclei. The % of metacaspase-positive cells was measured by FACS as described in Materials and Methods. (B) Truncation of the TM and the cytosolic tail of calnexin dramatically reduces the levels of metacaspase activation. Cells expressing cnx1+ (strain SP7951R) or mutants of calnexin (mini_cnx1, SP8490R; lumenal_cnx1, SP8488R; and lumenalTM_cnx1, SP8085R) at basal levels were treated with 10 μg/ml tunicamycin, and subsequently the % of metacaspase-positive cells was determined with FITC-VAD-FMK by FACS, as described in Materials and Methods. A global ANOVA showed that the values obtained among the strains were significantly different (p = 0.000). The significance of differences in the results was evaluated by a Student's t test, pairwise calculated with respect to the control for Cnx1p and to Cnx1p for the calnexin mutants. **p < 0.01 and *p < 0.05. (C) Association with BiP. Cells at OD 0.8–1.0 expressing Cnx1p (strain SP7951R) or lumenal_Cnx1p (SP8488R) were treated or not with 10 μg/ml tunicamycin. Immunoprecipitations were performed with anti-Cnx1p antibodies and the membrane was blotted with anti-Cnx1p antibodies or anti-BiP antibodies. Bands corresponding to Cnx1p, lumenal_Cnx1p or BiP were quantified with the Bio-RAD Quantity One 4.6.5 Basic program and reported as a ratio to Cnx1p untreated on a graph. The graph is representative of three different experiments. (D) Implication of Ire1p in apoptosis induced by calnexin overexpression. Cells overexpressing Cnx1p in a wild-type background (SP8007R) or in a Δire1 strain (SP8231R) and the control strain (empty vector, SP7975R and SP8227R) were stained with Phloxin B after 48 h of induction of overexpression to measure cell death. Stained cells were considered as dead. At different time points after the overexpression of Cnx1p cells were stained with the fluorescent probe FITC-VAD-FMK to measure metacaspase activation. Fluorescent cells were quantified by FACS. A global ANOVA showed that the values obtained among the strains were significantly different (p = 0.000). The significance of differences in the results was evaluated by a Student's t test, pairwise calculated with respect to the control for Cnx1p. **p < 0.01 and *p < 0.05. For metacaspase activation, the experiment was repeated three times, and this graph is a representation of a typical experiment. In this figure, vertical black arrows symbolize overexpression of the indicated protein.
Figure 6.
Figure 6.
The S. pombe metacaspase Pca1p and the homologue of Bap31 are not required for apoptosis induced by calnexin overexpression. (A) Survival of cells overexpressing Cnx1p in a Δpca1 or in a Δdma1/Bap31 strain (SP8081R and SP8136R) and the control strains (empty vector, SP7975R, SP8167R, and SP8145R), was assayed by serial dilution on inducing plates (without thiamine) and repressing plates (with thiamine). Samples of 10 μl of four 10-fold serial dilutions (10−1–10−4) of cells at 0.5 OD595 were spotted on selective MM and incubated at 30°C for 7 d (see Materials and Methods). (B) Percentage of dead cells measured by staining with fluorescent vital dye Phloxin B. Cells overexpressing Cnx1p in a wild-type background (SP8007R), in a Δpca1 strain (SP8081R) or in a ΔBap31 strain (SP8136R) and the control strain (empty vector, SP7975R) were stained with Phloxin B after 48 h of induction of overexpression and fluorescent cells were quantified by FACS. Stained cells were considered as dead. A global ANOVA showed that the values obtained among the strains were significantly different (p = 0.000). The significance of differences in the results was evaluated by a Student's t test, pairwise calculated with respect to the control for Cnx1p. **p < 0.01 and *p < 0.05. (C) Metacaspase activation. The fluorescent probe FITC-VAD-FMK was used to measure metacaspase activation by FACS, at different time points after the overexpression of Cnx1p in a wild-type background strain (SP8007R), in a Δpca1 strain (SP8081R) or in a ΔBap31 strain (SP8136R) and the control strain (empty vector, SP7975R) as described in the Materials and Methods. The experiment was repeated three times, and this graph is a representation of a typical experiment. In this figure, vertical black arrows symbolize overexpression of the indicated protein.
Figure 7.
Figure 7.
The S. pombe homologue of the human antiapoptotic HMGB1 inhibits apoptotic death induced due to calnexin overexpression. (A) Survival of cells overexpressing Cnx1p (strain SP8007R) alone and co-overexpressing Hmg1/2p, the S. pombe homologue of the human antiapoptotic HMGB1 protein, (strain SP16081) and the control strain (empty vector, SP7975R) was assayed by serial dilution on inducing plates (without thiamine) and repressing plates (with thiamine). Samples of 10 μl of four 10-fold serial dilutions (10−1–10−4) of cells at 0.5 OD595 were spotted on selective MM and incubated at 30°C for 7 d (see Materials and Methods). (B) Percentage of dead cells measured by staining with fluorescent vital dye Phloxin B. Cells overexpressing Cnx1p (strain SP8007R) alone and co-overexpressing Hmg1/2p, the S. pombe homologue of the human antiapoptotic HMGB1 protein, (strain SP16081) and the control strain (empty vector, SP7975R) were stained with Phloxin B after 48 h of induction of overexpression and fluorescent cells were quantified by FACS. Stained cells were considered as dead. A global ANOVA showed that the values obtained among the strains were significantly different (p = 0.000). The significance of differences in the results was evaluated by a Student's t test, pairwise calculated with respect to the control for Cnx1p and to Cnx1p for the Cnx1p + Hmg1/2p strain. **p < 0.01 and *p < 0.05. (C) Metacaspase activation. The fluorescent probe FITC-VAD-FMK was used to measure metacaspase activation by FACS, at different time points after the overexpression of Cnx1p (strain SP8007R) alone and co-overexpressing Hmg1/2p, the S. pombe homologue of the human antiapoptotic HMGB1 protein, (strain SP16081) and the control strain (empty vector, SP7975R) as described in the Materials and Methods. The experiment was repeated three times, and this graph is a representation of a typical experiment. In this figure, vertical black arrows symbolize overexpression of the indicated protein.
Figure 8.
Figure 8.
Overexpression of human calnexin induces apoptotic death in S. pombe. (A) Overexpression of human calnexin provokes cell death in S. pombe. Samples of 10 μl of four serial 10-fold dilutions (10−1–10−4) of 0.5 OD595 cells overexpressing human calnexin (strain SP16084), or control cells harboring the empty vector (strain SP7975R) were plated on selective minimal media and incubated at 30°C for 7 d. (B) Percentage of dead cells as measured with the vital fluorescent dye Phloxin B. Cells overexpressing human calnexin (strain SP16084) or control cells harboring the empty vector (strain SP7975R) were stained with Phloxin B after 48 h of induction of overexpression and fluorescent cells were quantified by FACS. Stained cells were considered as dead. The significance of differences in the results was evaluated by a Student's t test, pairwise calculated with respect to the control for human calnexin. **p < 0.01 and *p < 0.05. (C) Metacaspase activation. The fluorescent probe FITC-VAD-FMK was used to measure metacaspase activation by FACS, at different time points after the overexpression of human calnexin (SP16084), or control cells harboring the empty vector (strain SP7975R), as described in the Materials and Methods. The experiment was carried out three times and this graph represents a typical experiment. In this figure, vertical black arrows symbolize overexpression of the indicated protein.

Similar articles

Cited by

References

    1. Ahner A., Brodsky J. L. Checkpoints in ER-associated degradation: excuse me, which way to the proteasome? Trends Cell Biol. 2004;14:474–478. - PubMed
    1. Almeida B., Silva A., Mesquita A., Sampaio-Marques B., Rodrigues F., Ludovico P. Drug-induced apoptosis in yeast. Biochim. Biophys. Acta. 2008;1783:1436–1448. - PubMed
    1. Arunachalam B., Cresswell P. Molecular requirements for the interaction of class II major histocompatibility complex molecules and invariant chain with calnexin. J. Biol. Chem. 1995;270:2784–2790. - PubMed
    1. Barbet N., Muriel W. J., Carr A. M. Versatile shuttle vectors and genomic libraries for use with Schizosaccharomyces pombe. Gene. 1992;114:59–66. - PubMed
    1. Beaulieu H., Elagoz A., Crine P., Rokeach L. A. Interaction of mammalian neprilysin with binding protein and calnexin in Schizosaccharomyces pombe. Biochem. J. 1999;340(Pt 3):813–819. - PMC - PubMed

Publication types

LinkOut - more resources