

UCP2 is highly expressed in pancreatic alpha-cells and influences secretion and survival
- PMID: 18701716
- PMCID: PMC2575296
- DOI: 10.1073/pnas.0710434105
UCP2 is highly expressed in pancreatic alpha-cells and influences secretion and survival
Abstract
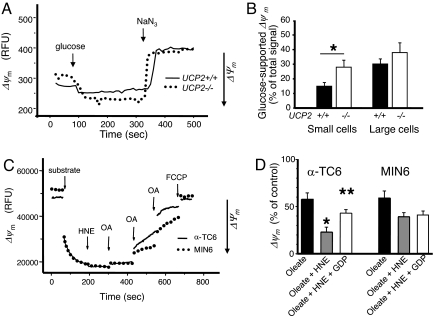
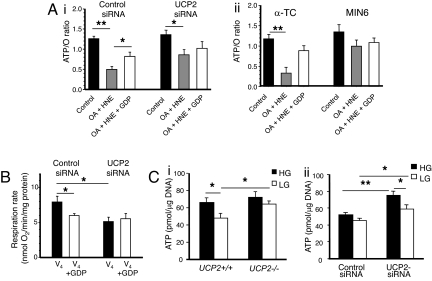
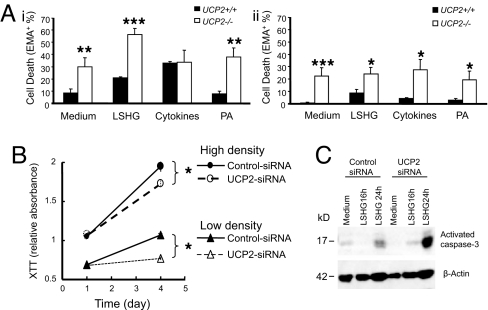
In pancreatic beta-cells, uncoupling protein 2 (UCP2) influences mitochondrial oxidative phosphorylation and insulin secretion. Here, we show that alpha-cells express significantly higher levels of UCP2 than do beta-cells. Greater mitochondrial UCP2-related uncoupling was observed in alpha-cells compared with beta-cells and was accompanied by a lower oxidative phosphorylation efficiency (ATP/O). Conversely, reducing UCP2 activity in alpha-cells was associated with higher mitochondrial membrane potential generated by glucose oxidation and with increased ATP synthesis, indicating more efficient metabolic coupling. In vitro, the suppression of UCP2 activity led to reduced glucagon secretion in response to low glucose; however, in vivo, fasting glucagon levels were normal in UCP2(-/-) mice. In addition to its effects on secretion, UCP2 played a cytoprotective role in islets, with UCP2(-/-) alpha-cells being more sensitive to specific death stimuli. In summary, we demonstrate a direct role for UCP2 in maintaining alpha-cell function at the level of glucose metabolism, glucagon secretion, and cytoprotection.
Conflict of interest statement
The authors declare no conflict of interest.
Figures


Similar articles
-
UCP2 regulates the glucagon response to fasting and starvation.Diabetes. 2013 May;62(5):1623-33. doi: 10.2337/db12-0981. Epub 2013 Feb 22. Diabetes. 2013. PMID: 23434936 Free PMC article.
-
Beta-cell uncoupling protein 2 regulates reactive oxygen species production, which influences both insulin and glucagon secretion.Diabetes. 2011 Nov;60(11):2710-9. doi: 10.2337/db11-0132. Epub 2011 Oct 7. Diabetes. 2011. PMID: 21984579 Free PMC article.
-
Uncoupling protein 2 regulates reactive oxygen species formation in islets and influences susceptibility to diabetogenic action of streptozotocin.J Endocrinol. 2009 Oct;203(1):33-43. doi: 10.1677/JOE-09-0117. Epub 2009 Jul 27. J Endocrinol. 2009. PMID: 19635759
-
Mitochondrial uncoupling protein 2 in pancreatic β-cells.Diabetes Obes Metab. 2010 Oct;12 Suppl 2:134-40. doi: 10.1111/j.1463-1326.2010.01264.x. Diabetes Obes Metab. 2010. PMID: 21029310 Review.
-
Antioxidant and regulatory role of mitochondrial uncoupling protein UCP2 in pancreatic beta-cells.Physiol Res. 2014;63(Suppl 1):S73-91. doi: 10.33549/physiolres.932633. Physiol Res. 2014. PMID: 24564667 Review.
Cited by
-
UCP2 regulates the glucagon response to fasting and starvation.Diabetes. 2013 May;62(5):1623-33. doi: 10.2337/db12-0981. Epub 2013 Feb 22. Diabetes. 2013. PMID: 23434936 Free PMC article.
-
Coenzyme Q10 depletion in medical and neuropsychiatric disorders: potential repercussions and therapeutic implications.Mol Neurobiol. 2013 Dec;48(3):883-903. doi: 10.1007/s12035-013-8477-8. Epub 2013 Jun 13. Mol Neurobiol. 2013. PMID: 23761046 Review.
-
Glutaredoxin-2 is required to control proton leak through uncoupling protein-3.J Biol Chem. 2013 Mar 22;288(12):8365-8379. doi: 10.1074/jbc.M112.442905. Epub 2013 Jan 18. J Biol Chem. 2013. PMID: 23335511 Free PMC article.
-
Mitochondrial uncoupling protein 2: a central player in pancreatic disease pathophysiology.Mol Med. 2024 Dec 20;30(1):259. doi: 10.1186/s10020-024-01027-y. Mol Med. 2024. PMID: 39707176 Free PMC article. Review.
-
Submembrane ATP and Ca2+ kinetics in α-cells: unexpected signaling for glucagon secretion.FASEB J. 2015 Aug;29(8):3379-88. doi: 10.1096/fj.14-265918. Epub 2015 Apr 24. FASEB J. 2015. PMID: 25911612 Free PMC article.
References
-
- Ahren B. Type 2 diabetes, insulin secretion and beta-cell mass. Curr Mol Med. 2005;5:275–286. - PubMed
-
- Greenbaum CJ, Prigeon RL, D'Alessio DA. Impaired beta-cell function, incretin effect, and glucagon suppression in patients with type 1 diabetes who have normal fasting glucose. Diabetes. 2002;51:951–957. - PubMed
-
- Shah P, Basu A, Basu R, Rizza R. Impact of lack of suppression of glucagon on glucose tolerance in humans. Am J Physiol. 1999;277:E283–290. - PubMed
-
- Cryer PE. Diverse causes of hypoglycemia-associated autonomic failure in diabetes. N Engl J Med. 2004;350:2272–2279. - PubMed
-
- Diao J, Asghar Z, Chan CB, Wheeler MB. Glucose-regulated glucagon secretion requires insulin receptor expression in pancreatic alpha-cells. J Biol Chem. 2005;280:33487–33496. - PubMed
Publication types
MeSH terms
Substances
LinkOut - more resources
Full Text Sources
Other Literature Sources
Molecular Biology Databases
