. 2008 Oct;100(4):1983-94.
doi: 10.1152/jn.90635.2008. Epub 2008 Aug 13.

Differential activity-dependent, homeostatic plasticity of two neocortical inhibitory circuits

Affiliations

Differential activity-dependent, homeostatic plasticity of two neocortical inhibitory circuits

Aundrea F Bartley et al. J Neurophysiol. 2008 Oct.

Abstract

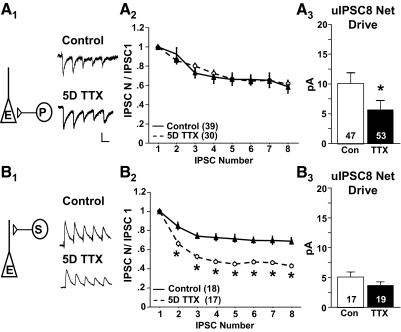
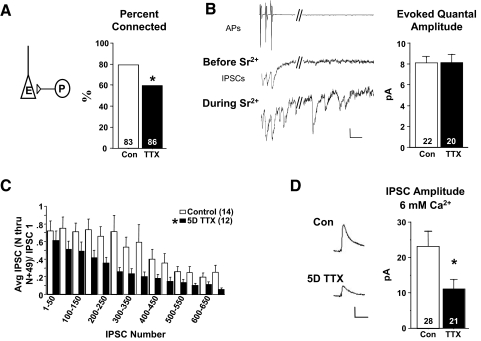
Chronic changes in neuronal activity homeostatically regulate excitatory circuitry. However, little is known about how activity regulates inhibitory circuits or specific inhibitory neuron types. Here, we examined the activity-dependent regulation of two neocortical inhibitory circuits--parvalbumin-positive (Parv+) and somatostatin-positive (Som+)--using paired recordings of synaptically coupled neurons. Action potentials were blocked for 5 days in slice culture, and unitary synaptic connections among inhibitory/excitatory neuron pairs were examined. Chronic activity blockade caused similar and distinct changes between the two inhibitory circuits. First, increases in intrinsic membrane excitability and excitatory synaptic drive in both inhibitory subtypes were consistent with the homeostatic regulation of firing rate of these neurons. On the other hand, inhibitory synapses originating from these two subtypes were differentially regulated by activity blockade. Parv+ unitary inhibitory postsynaptic current (uIPSC) strength was decreased while Som+ uIPSC strength was unchanged. Using short-duration stimulus trains, short-term plasticity for both unitary excitatory postsynaptic current (uEPSCs) and uIPSCs was unchanged in Parv+ circuitry while distinctively altered in Som+ circuitry--uEPSCs became less facilitating and uIPSCs became more depressing. In the context of recurrent inhibition, these changes would result in a frequency-dependent shift in the relative influence of each circuit. The functional changes at both types of inhibitory connections appear to be mediated by increases in presynaptic release probability and decreases in synapse number. Interestingly, these opposing changes result in decreased Parv+-mediated uIPSCs but balance out to maintain normal Som+-mediated uIPSCs. In summary, these results reveal that inhibitory circuitry is not uniformly regulated by activity levels and may provide insight into the mechanisms of both normal and pathological neocortical plasticity.


Figures

FIG. 1.
FIG. 1.
Consistent with homeostatic regulation in inhibitory neurons, chronic activity blockade enhances excitatory drive onto both inhibitory neuron subtypes. A1 and B1: unitary excitatory postsynaptic currents (uEPSCs) evoked from excitatory neurons (E) were examined in neighboring Parv+ (P) and Som+ (S) inhibitory neurons. Top: example of a presynaptic action potential (AP, truncated vertically). Note that APs are recorded in voltage clamp mode. Bottom: uEPSCs evoked in control and TTX-treated cultures. A2 and B2: percent connected of all test pairs is increased for Parv+ but not for Som+ circuitry (but see Fig. 5A with larger data set). A3 and B3: average uEPSC1 (1st uEPSC in a train) amplitude was dramatically increased in both subtypes. A4 and B4: net excitatory drive, the average of both connected and nonconnected (0 pA) pairs, was increased at both subtypes. Scale bars: vertical, 700 and 10 pA for APs and PSCs, respectively. Horizontal, 50 ms. *P < 0.03. Sample number indicated in bars.
FIG. 2.
FIG. 2.
Chronic activity blockade differentially regulates inhibitory synaptic drive onto excitatory neurons. A1 and B1: uIPSCs were evoked from Parv+ (P) and Som+ (S) neurons and examined in neighboring excitatory neurons (E). Parv+ uIPSCs were recorded using “high Cl” pipette solution, and hence displayed downward waveforms. A2 and B2: percent connected of Parv+ uIPSCs, but not Som+ uIPSCs, is decreased with chronic blockade (Chi-Sqr). A3 and B3: when a connection existed, average uIPSC1 amplitude was not affected for either inhibitory connection type. A4 and B4: net inhibitory drive was only decreased for Parv+-mediated uIPSCs. Scale bars: vertical, 700 and 10 pA for APs and PSCs, respectively. Horizontal, 50 ms. *P < 0.05.
FIG. 3.
FIG. 3.
Short-term plasticity is differentially regulated at excitatory synapses. A1 and B1: recordings of uEPSC trains. A2 and B2: Som+ uEPSCs became more depressing with TTX treatment while no change was detected in Parv+ uEPSCs. A3 and B3: net excitatory drive at uEPSC5 was increased for both inhibitory neuron subtypes. Scale bars: vertical, 500 and 10 pA. Horizontal, 50 ms. *P < 0.02, **P < 0.004.
FIG. 4.
FIG. 4.
Chronic activity blockade differentially regulates short-term plasticity of uIPSCs. A1 and B1: uIPSC trains were evoked by trains of presynaptic action potentials (top). A2 and B2: while short-term plasticity is unaltered with Parv+ uIPSCs, Som+ uIPSCs become dramatically more depressing. A3 and B3: net drive for uIPSC8 is decreased at Parv+, but not Som+, synapses. Scale bars: vertical, 5 pA. Horizontal, 50 ms. *P < 0.004.
FIG. 5.
FIG. 5.
Increased connectivity suggests an increase in synapse number mediating the increase in uEPSC drive. A1 and B1: an increase in percent connected for all tested pairs suggests that increased synapse number is involved in the uEPSC increase. A2 and B2: no changes were observed in mEPSC properties.
FIG. 6.
FIG. 6.
Increased quantal content, not quantal size, mediating the increased strength of uEPSCs targeting Som+ neurons. CV (A) and failures (B) of uEPSCs are decreased with activity blockade suggesting increased quantal content. C: an experiment from control slices where Sr2+ was substituted for Ca2+ to induce asynchronous release. The AP shown is the last in a train of 15. The EPSC in the control trace is truncated. D: a small decrease in quantal size after chronic TTX treatment indicates that changes in synaptic efficacy, and probably postsynaptic receptor function, do not account for the increased excitatory drive. Scale bars: vertical, 1000 and 10 pA. Horizontal, 50 ms. *P < 0.05.
FIG. 7.
FIG. 7.
With Parv+ uIPSCs, activity blockade does not affect quantal size but increases release probability. A: percent connected is decreased in all experiments performed examining Parv+ uIPSCs suggesting fewer synaptic contacts. B: Sr2+ was substituted for Ca2+ to induce asynchronous release and enable the measurement of quantal events directly mediating uIPSCs. The trace epoch shown occurs during the last 3 action potentials in a train of 15. Quantal size was unchanged with TTX treatment, suggesting that regulation does not involve a postsynaptic efficacy mechanism (n = 22,20). Slashes represent 350 ms of omitted trace. Scale bars: vertical, 500 and 5 pA. Horizontal, 50 ms. C: long stimulus trains are more depressing after 5-day TTX treatment, suggesting an increase in release probability (n = 14,12). *P < 0.05, calculated with repeated-measures ANOVA. D: when release probability is increased to diminish the role of increased release probability, a decrease in uIPSC amplitude emerges (K-Gluc pipette solution used so currents are outward). Scale bars: vertical, 10 pA. Horizontal, 50 ms. *P < 0.03.
FIG. 8.
FIG. 8.
A decrease in Som+ inhibitory “putative” boutons and synaptic contacts. A: no change in the percent connected for Som+-mediated uIPSCs after chronic activity for all pairs recorded. B: images of presynaptic axons and boutons (GFP) and postsynaptic excitatory neuron dendrites (DsRed). Putative contacts are indicated by arrow heads. Some axons travel in and out of the image plane. Each image is a superposition of images creating a 4.8-μm-thick section, and hence some colocalized spots are not putative contacts because they are separated by >0.5 μm in depth. Scale bars, 5 μm. C: the GFP intensity distribution along an axon shows periodic increases that we define as “putative” presynaptic boutons. Dotted and solid horizontal lines represent baseline and threshold intensity levels. D: the density of “putative” presynaptic boutons is decreased with activity blockade (n = 29,20 images). E: intensity distributions of DsRed (red) and GFP (green) at a “putative” synaptic contact. Vertical dashed lines show the amount of overlap between the 2 distributions. F: “putative” synaptic contacts are decreased, also (n = 16,13 cells) *P < 0.02.

References

    1. Abbott LF, Varela JA, Sen K, Nelson SB. Synaptic depression and cortical gain control. Science 275: 220–224, 1997. - PubMed
    1. Beierlein M, Gibson JR, Connors BW. Two dynamically distinct inhibitory networks in layer 4 of the neocortex. J Neurophysiol 90: 2987–3000, 2003. - PubMed
    1. Burrone J, O'Byrne M, Murthy VN. Multiple forms of synaptic plasticity triggered by selective suppression of activity in individual neurons. Nature 420: 414–418, 2002. - PubMed
    1. Calakos N, Schoch S, Sudhof TC, Malenka RC. Multiple roles for the active zone protein RIM1alpha in late stages of neurotransmitter release. Neuron 42: 889–896, 2004. - PubMed
    1. Chattopadhyaya B, Di Cristo G, Higashiyama H, Knott GW, Kuhlman SJ, Welker E, Huang ZJ. Experience and activity-dependent maturation of perisomatic GABAergic innervation in primary visual cortex during a postnatal critical period. J Neurosci 24: 9598–9611, 2004. - PMC - PubMed

Publication types

MeSH terms

LinkOut - more resources