

Measures of obesity and cardiovascular risk among men and women
- PMID: 18702962
- PMCID: PMC2671389
- DOI: 10.1016/j.jacc.2008.03.066
Measures of obesity and cardiovascular risk among men and women
Abstract
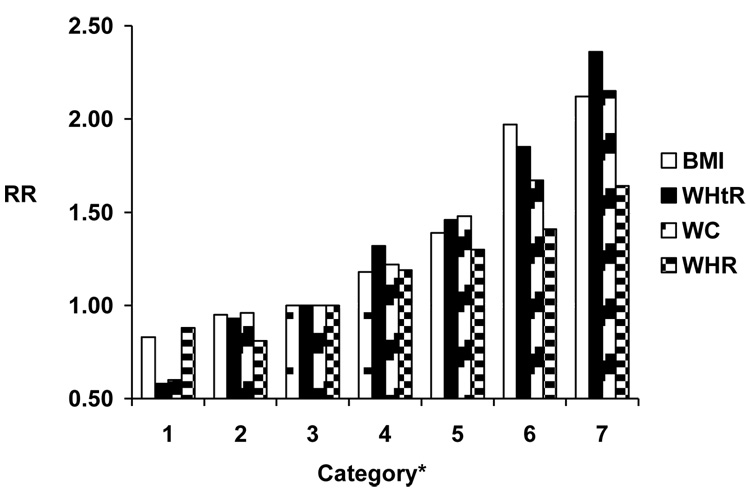
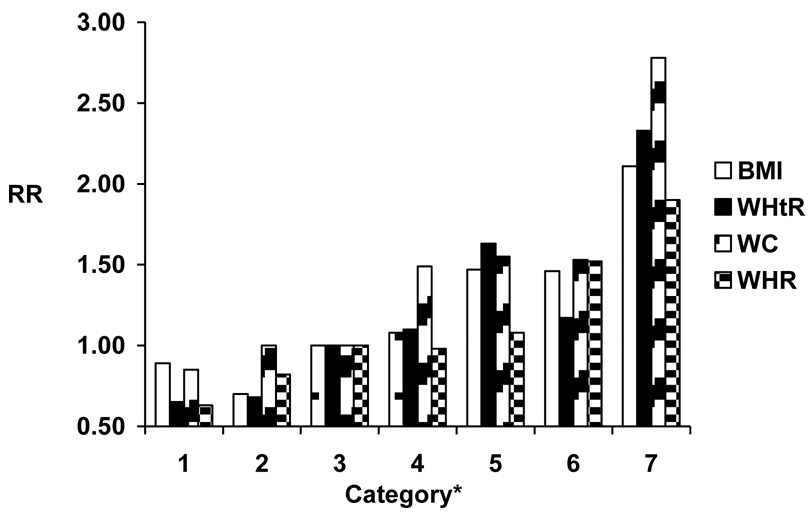
Objectives: This study examined associations between anthropometric measures (body mass index, waist circumference, waist-to-hip ratio, waist-to-height ratio [WHtR]) and risk of incident cardiovascular disease (CVD) (including nonfatal myocardial infarction, nonfatal ischemic stroke, and cardiovascular death).
Background: Controversy exists regarding the optimal approach to measure adiposity, and the utility of body mass index has been questioned.
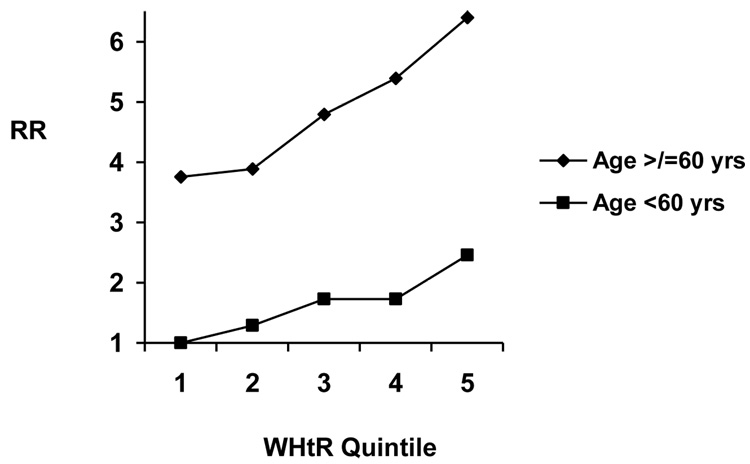
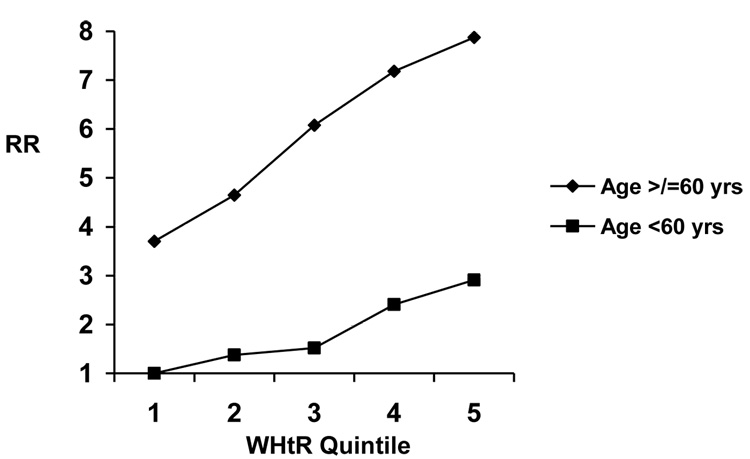
Methods: Participants included 16,332 men in the Physicians' Health Study (mean age 61 years in 1991) and 32,700 women in the Women's Health Study (mean age 61 years in 1999). We used Cox proportional hazards models to determine relative risks and 95% confidence intervals (CIs) for developing CVD according to self-reported anthropometric indexes.
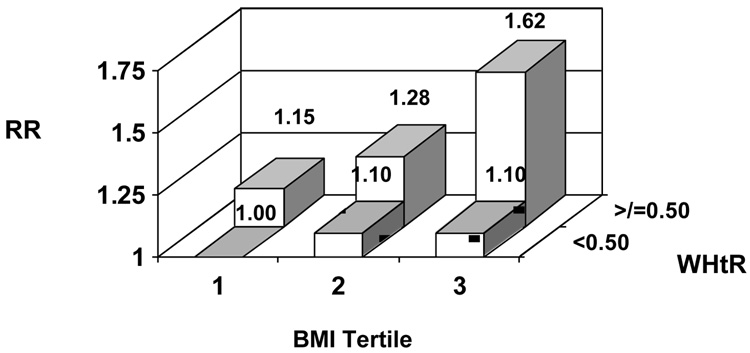
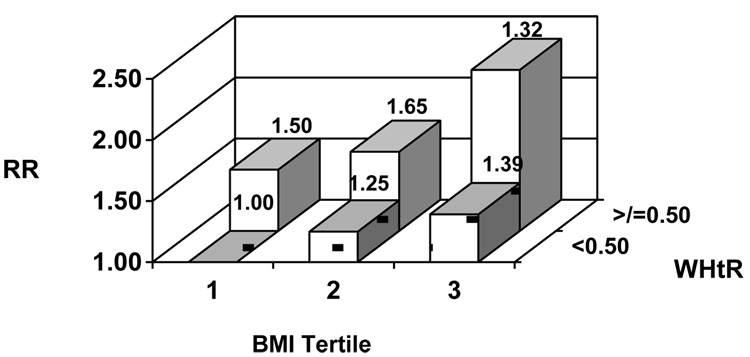
Results: A total of 1,505 CVD cases occurred in men and 414 occurred in women (median follow-up 14.2 and 5.5 years, respectively). Although WHtR demonstrated statistically the strongest associations with CVD and best model fit, CVD risk increased linearly and significantly with higher levels of all indexes. Adjusting for confounders, the relative risk for CVD was 0.58 (95% CI: 0.32 to 1.05) for men with the lowest WHtR (<0.45) and 2.36 (95% CI: 1.61 to 3.47) for the highest WHtR (>/=0.69; vs. WHtR 0.49 to <0.53). Among women, the relative risk was 0.65 (95% CI: 0.33 to 1.31) for those with the lowest WHtR (<0.42) and 2.33 (95% CI: 1.66 to 3.28) for the highest WHtR (>/=0.68; vs. WHtR 0.47 to <0.52).
Conclusions: The WHtR demonstrated statistically the best model fit and strongest associations with CVD. However, compared with body mass index, differences in cardiovascular risk assessment using other indexes were small and likely not clinically consequential. Our findings emphasize that higher levels of adiposity, however measured, confer increased risk of CVD.
Figures
Comment in
-
Which measures of obesity best predict cardiovascular risk?J Am Coll Cardiol. 2008 Aug 19;52(8):616-9. doi: 10.1016/j.jacc.2008.05.017. J Am Coll Cardiol. 2008. PMID: 18702963 No abstract available.
-
Problems in measurement of body "fatness".J Am Coll Cardiol. 2009 Feb 10;53(6):526-7; author reply 527-8. doi: 10.1016/j.jacc.2008.09.059. J Am Coll Cardiol. 2009. PMID: 19195612 No abstract available.
-
Is body mass index really the best measure of obesity in individuals?J Am Coll Cardiol. 2009 Feb 10;53(6):526; author reply 527-8. doi: 10.1016/j.jacc.2008.08.078. J Am Coll Cardiol. 2009. PMID: 19195613 No abstract available.
Similar articles
-
Prognostic significance of the complex "Visceral Adiposity Index" vs. simple anthropometric measures: Tehran lipid and glucose study.Cardiovasc Diabetol. 2012 Mar 7;11:20. doi: 10.1186/1475-2840-11-20. Cardiovasc Diabetol. 2012. PMID: 22394430 Free PMC article.
-
New indexes of body fat distribution and sex-specific risk of total and cause-specific mortality: a prospective cohort study.BMC Public Health. 2018 Apr 2;18(1):427. doi: 10.1186/s12889-018-5350-8. BMC Public Health. 2018. PMID: 29609587 Free PMC article.
-
The development of cardiovascular disease in relation to anthropometric indices and hypertension in British adults.Int J Obes Relat Metab Disord. 1998 Oct;22(10):966-73. doi: 10.1038/sj.ijo.0800705. Int J Obes Relat Metab Disord. 1998. PMID: 9806311
-
Waist-to-height ratio and body fat percentage as risk factors for ischemic cardiovascular disease: a prospective cohort study from UK Biobank.Am J Clin Nutr. 2024 Jun;119(6):1386-1396. doi: 10.1016/j.ajcnut.2024.03.018. Epub 2024 May 9. Am J Clin Nutr. 2024. PMID: 38839194 Free PMC article.
-
Degree of association between the body mass index (BMI), waist-hip ratio (WHR), waist-height ratio (WHtR), body adiposity index (BAI) and conicity index (CI) in physically active older adults.Clin Nutr ESPEN. 2023 Dec;58:335-341. doi: 10.1016/j.clnesp.2023.10.007. Epub 2023 Oct 14. Clin Nutr ESPEN. 2023. PMID: 38057024
Cited by
-
Mortality and Exacerbation Risk by Body Mass Index in Patients with COPD in TIOSPIR and UPLIFT.Ann Am Thorac Soc. 2022 Feb;19(2):204-213. doi: 10.1513/AnnalsATS.202006-722OC. Ann Am Thorac Soc. 2022. PMID: 34406915 Free PMC article.
-
Waist-to-height ratio as a screening tool for obesity and cardiometabolic risk.Korean J Pediatr. 2016 Nov;59(11):425-431. doi: 10.3345/kjp.2016.59.11.425. Epub 2016 Nov 18. Korean J Pediatr. 2016. PMID: 27895689 Free PMC article. Review.
-
A Resampling Approach for Causal Inference on Novel Two-Point Time-Series with Application to Identify Risk Factors for Type-2 Diabetes and Cardiovascular Disease.Stat Biosci. 2025;17(1):78-131. doi: 10.1007/s12561-023-09390-w. Epub 2023 Oct 16. Stat Biosci. 2025. PMID: 40061216 Free PMC article.
-
Incremental effects of endocrine and metabolic biomarkers and abdominal obesity on cardiovascular mortality prediction.PLoS One. 2012;7(3):e33084. doi: 10.1371/journal.pone.0033084. Epub 2012 Mar 16. PLoS One. 2012. PMID: 22438892 Free PMC article.
-
Waist-to-height ratio as a predictor of serum testosterone in ageing men with symptoms of androgen deficiency.Asian J Androl. 2011 May;13(3):424-31. doi: 10.1038/aja.2011.13. Epub 2011 Apr 11. Asian J Androl. 2011. PMID: 21478893 Free PMC article.
References
-
- Curbing the obesity epidemic. Lancet. 2006;367:1549. - PubMed
-
- Clinical Guidelines on the Identification, Evaluation, and Treatment of Overweight and Obesity in Adults--The Evidence Report. National Institutes of Health. Obes Res. 1998. pp. 51S–209S. - PubMed
-
- World Health Organization. WHO Technical Report Series no. 894. (ISBN Number 92 4 120894 5) Geneva: WHO; 2000. Obesity: Preventing and Managing the Global Epidemic. - PubMed
-
- James WP. Assessing obesity: are ethnic differences in body mass index and waist classification criteria justified? Obes Rev. 2005;6:179–181. - PubMed
-
- Franzosi MG. Should we continue to use BMI as a cardiovascular risk factor? Lancet. 2006;368:624–625. - PubMed
Publication types
MeSH terms
Grants and funding
- CA-40360/CA/NCI NIH HHS/United States
- CA-34944/CA/NCI NIH HHS/United States
- HL-34595/HL/NHLBI NIH HHS/United States
- HL-26490/HL/NHLBI NIH HHS/United States
- R01 HL043851/HL/NHLBI NIH HHS/United States
- CA-047988/CA/NCI NIH HHS/United States
- R01 HL034595/HL/NHLBI NIH HHS/United States
- T32 AG000158/AG/NIA NIH HHS/United States
- HL-043851/HL/NHLBI NIH HHS/United States
- R01 HL026490/HL/NHLBI NIH HHS/United States
- CA-097193/CA/NCI NIH HHS/United States
- R01 CA040360/CA/NCI NIH HHS/United States
- R01 CA097193/CA/NCI NIH HHS/United States
- R01 CA034944/CA/NCI NIH HHS/United States
- R01 CA047988/CA/NCI NIH HHS/United States
- HL-080467/HL/NHLBI NIH HHS/United States
LinkOut - more resources
Full Text Sources
Medical
