

Agonist-selective, receptor-specific interaction of human P2Y receptors with beta-arrestin-1 and -2
- PMID: 18703513
- PMCID: PMC2662168
- DOI: 10.1074/jbc.M801472200
Agonist-selective, receptor-specific interaction of human P2Y receptors with beta-arrestin-1 and -2
Abstract
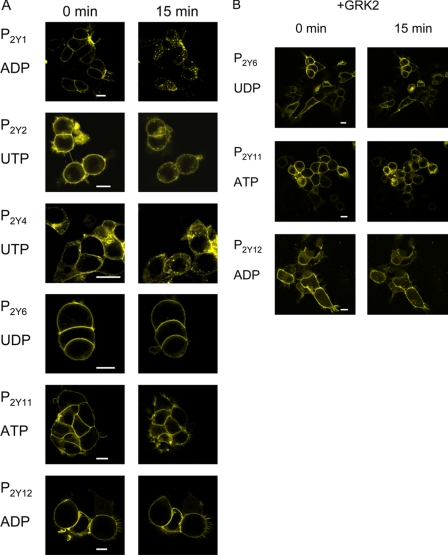
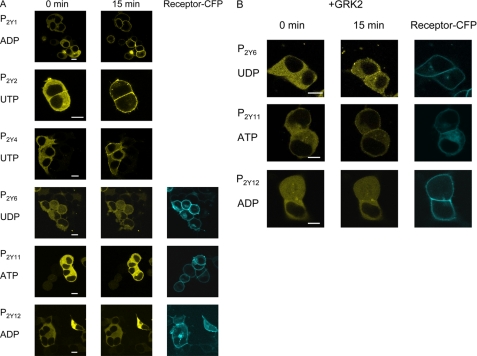
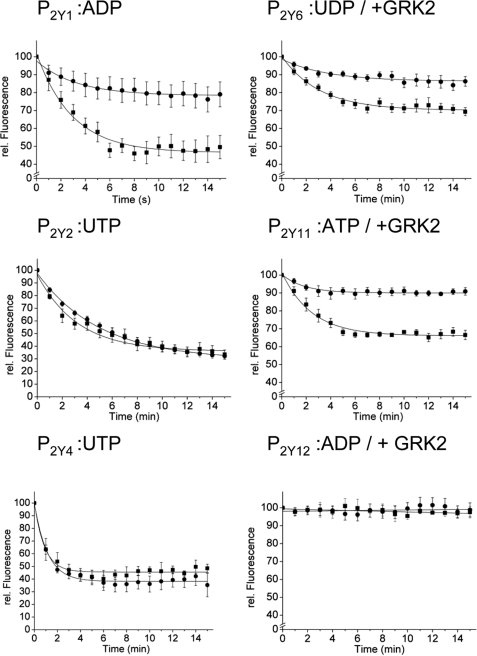
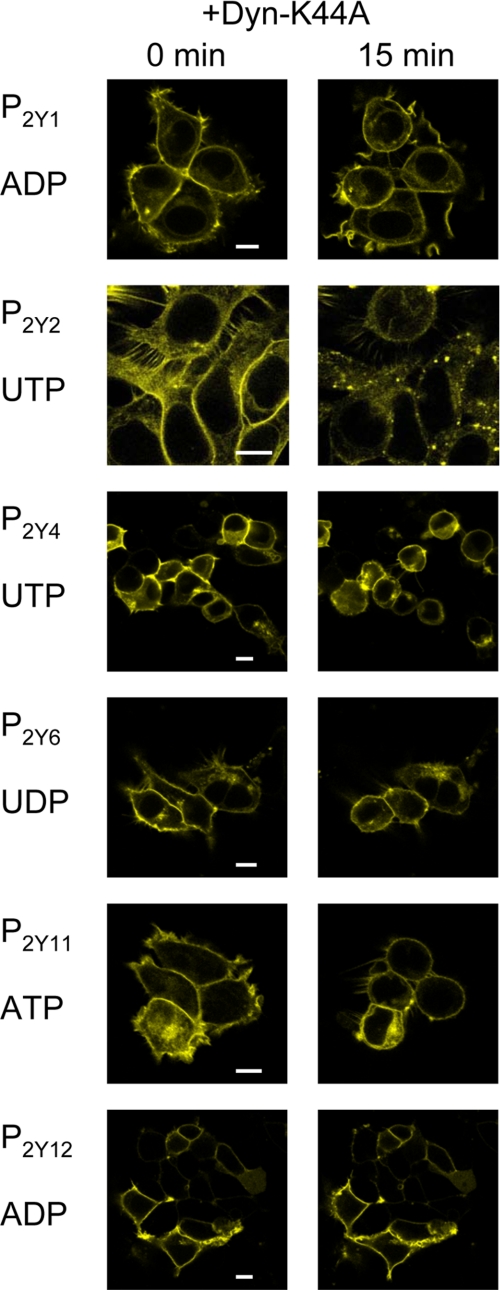
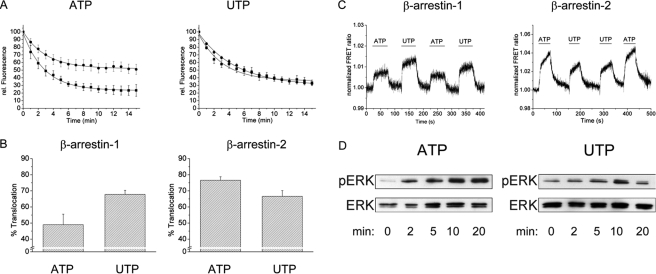
Interaction of G-protein-coupled receptors with beta-arrestins is an important step in receptor desensitization and in triggering "alternative" signals. By means of confocal microscopy and fluorescence resonance energy transfer, we have investigated the internalization of the human P2Y receptors 1, 2, 4, 6, 11, and 12 and their interaction with beta-arrestin-1 and -2. Co-transfection of each individual P2Y receptor with beta-arrestin-1-GFP or beta-arrestin-2-YFP into HEK-293 cells and stimulation with the corresponding agonists resulted in a receptor-specific interaction pattern. The P2Y(1) receptor stimulated with ADP strongly translocated beta-arrestin-2-YFP, whereas only a slight translocation was observed for beta-arrestin-1-GFP. The P2Y(4) receptor exhibited equally strong translocation for beta-arrestin-1-GFP and beta-arrestin-2-YFP when stimulated with UTP. The P2Y(6), P2Y(11), and P2Y(12) receptor internalized only when GRK2 was additionally co-transfected, but beta-arrestin translocation was only visible for the P2Y(6) and P2Y(11) receptor. The P2Y(2) receptor showed a beta-arrestin translocation pattern that was dependent on the agonist used for stimulation. UTP translocated beta-arrestin-1-GFP and beta-arrestin-2-YFP equally well, whereas ATP translocated beta-arrestin-1-GFP to a much lower extent than beta-arrestin-2-YFP. The same agonist-dependent pattern was seen in fluorescence resonance energy transfer experiments between the fluorescently labeled P2Y(2) receptor and beta-arrestins. Thus, the P2Y(2) receptor would be classified as a class A receptor when stimulated with ATP or as a class B receptor when stimulated with UTP. The ligand-specific recruitment of beta-arrestins by ATP and UTP stimulation of P2Y(2) receptors was further found to result in differential stimulation of ERK phosphorylation. This suggests that the two different agonists induce distinct active states of this receptor that show differential interactions with beta-arrestins.
Figures
Similar articles
-
beta-Arrestin-2 interaction and internalization of the human P2Y1 receptor are dependent on C-terminal phosphorylation sites.Mol Pharmacol. 2009 Dec;76(6):1162-71. doi: 10.1124/mol.109.060467. Epub 2009 Sep 9. Mol Pharmacol. 2009. PMID: 19741005
-
G protein-coupled receptor kinase 2 and arrestin2 regulate arterial smooth muscle P2Y-purinoceptor signalling.Cardiovasc Res. 2011 Jan 1;89(1):193-203. doi: 10.1093/cvr/cvq249. Epub 2010 Aug 12. Cardiovasc Res. 2011. PMID: 20705669 Free PMC article.
-
Selective regulation of endogenous G protein-coupled receptors by arrestins in HEK293 cells.J Biol Chem. 2000 Apr 28;275(17):12900-8. doi: 10.1074/jbc.275.17.12900. J Biol Chem. 2000. PMID: 10777589
-
The Two β-Arrestins Regulate Distinct Metabolic Processes: Studies with Novel Mutant Mouse Models.Int J Mol Sci. 2022 Jan 2;23(1):495. doi: 10.3390/ijms23010495. Int J Mol Sci. 2022. PMID: 35008921 Free PMC article. Review.
-
The functional cycle of visual arrestins in photoreceptor cells.Prog Retin Eye Res. 2011 Nov;30(6):405-30. doi: 10.1016/j.preteyeres.2011.07.002. Epub 2011 Jul 29. Prog Retin Eye Res. 2011. PMID: 21824527 Free PMC article. Review.
Cited by
-
P2Y(12) receptors in platelets and other hematopoietic and non-hematopoietic cells.Purinergic Signal. 2012 Sep;8(3):609-19. doi: 10.1007/s11302-012-9303-x. Epub 2012 Apr 11. Purinergic Signal. 2012. PMID: 22528678 Free PMC article. Review.
-
Caveolin-1 Regulates P2Y2 Receptor Signaling during Mechanical Injury in Human 1321N1 Astrocytoma.Biomolecules. 2019 Oct 18;9(10):622. doi: 10.3390/biom9100622. Biomolecules. 2019. PMID: 31635212 Free PMC article.
-
Targeted activation of conventional and novel protein kinases C through differential translocation patterns.Mol Cell Biol. 2014 Jul;34(13):2370-81. doi: 10.1128/MCB.00040-14. Epub 2014 Apr 14. Mol Cell Biol. 2014. PMID: 24732802 Free PMC article.
-
Temporal cAMP Signaling Selectivity by Natural and Synthetic MC4R Agonists.Mol Endocrinol. 2015 Nov;29(11):1619-33. doi: 10.1210/me.2015-1071. Epub 2015 Sep 29. Mol Endocrinol. 2015. PMID: 26418335 Free PMC article.
-
Arrestins 2 and 3 differentially regulate ETA and P2Y2 receptor-mediated cell signaling and migration in arterial smooth muscle.Am J Physiol Cell Physiol. 2012 Mar 1;302(5):C723-34. doi: 10.1152/ajpcell.00202.2011. Epub 2011 Dec 7. Am J Physiol Cell Physiol. 2012. PMID: 22159081 Free PMC article.
References
-
- Gilman, A. G. (1987) Annu. Rev. Biochem. 56 615-6491 - PubMed
-
- Kohout, T. A., and Lefkowitz, R. J. (2003) Mol. Pharmacol. 63 9-18 - PubMed
-
- Lohse, M. J., Benovic, J. L., Codina, J., Caron, M. G., and Lefkowitz, R. J. (1990) Science 248 1547-1550 - PubMed
-
- Oakley, R. H., Laporte, S. A., Holt, J. A., Caron, M. G., and Barak, L. S. (2000) J. Biol. Chem. 275 17201-17210 - PubMed
Publication types
MeSH terms
Substances
LinkOut - more resources
Full Text Sources
Other Literature Sources
Molecular Biology Databases
Miscellaneous
