. 2009 Jan;8(1):53-69.
doi: 10.1074/mcp.M800103-MCP200. Epub 2008 Aug 14.

Spectral dictionaries: Integrating de novo peptide sequencing with database search of tandem mass spectra

Affiliations

Spectral dictionaries: Integrating de novo peptide sequencing with database search of tandem mass spectra

Sangtae Kim et al. Mol Cell Proteomics. 2009 Jan.

Abstract

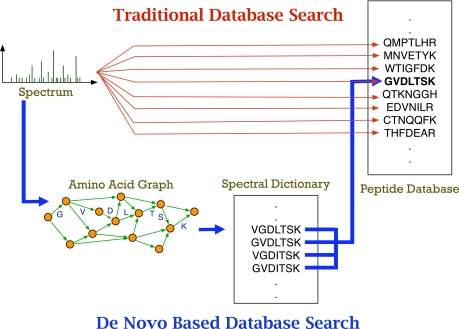
Database search tools identify peptides by matching tandem mass spectra against a protein database. We study an alternative approach when all plausible de novo interpretations of a spectrum (spectral dictionary) are generated and then quickly matched against the database. We present a new MS-Dictionary algorithm for efficiently generating spectral dictionaries and demonstrate that MS-Dictionary can identify spectra that are missed in the database search. We argue that MS-Dictionary enables proteogenomics searches in six-frame translation of genomic sequences that may be prohibitively time-consuming for existing database search approaches. We show that such searches allow one to correct sequencing errors and find programmed frameshifts.


Figures

F<sc>ig</sc>. 1.
Fig. 1.
Two approaches to peptide identification: traditional approach based on comparing spectra with the database (red) and the hybrid approach based on constructing spectral dictionaries and fast database lookup (blue). The red lines illustrate that in traditional searches every spectrum should be compared with every peptide in the database with a given parent mass (the running time scales linearly with the database size). The blue lines illustrate that every peptide in the spectral dictionary should be checked for presence in the database (the running time is negligible if the database is preprocessed as a hash table or a suffix tree). The running time of the de novo-based approaches is nearly independent of the database size (it is dominated by the time required to generate the spectral dictionaries). The fast database lookup can be implemented either as exact matching or as error-tolerant lookup (to search for mutations/polymorphisms).
F<sc>ig</sc>. 2.
Fig. 2.
Left, probability Prob (x|y) of a peptide symbol y generating a spectrum symbol x. Right, the amino acid graph G for all peptides with parent mass 7 and only two possible “amino acids” A and B with masses 2 and 3, correspondingly. The highlighted path corresponds to the G-peptide 0101001 corresponding to AAB (masses of consecutive amino acid masses are 2, 2, and 3). Two other G-peptides with parent mass 7 are 0100101 (ABA) and 0010101 (BAA). The probability of a spectrum s = s1sn being generated by a peptide π = π1 … πn is defined as Prob(s|π) = Πi = 1n Prob(sii). This is illustrated above with π = 0101001 and s = 0001101 (Prob(s = 0001101, π = 0101001) = θ·(1 − θ)3 ρ2 (1 − ρ)).
F<sc>ig</sc>. 3.
Fig. 3.
Correlation between InsPecT and MS-Dictionary scores computed on randomly selected 50,000 spectra (correlation coefficient is 0.96).
F<sc>ig</sc>. 4.
Fig. 4.
a, comparison of template-free (solid line) and template-based (dashed line) recalibrations for a single spectrum. Each black dot represents a two-dimensional point (m, Frac(m)) for a mass m (for every peak in the rescaled and filtered spectrum). Each white dot represents a two-dimensional point (m, Error(m)) for a b- or y-peak with mass m and the difference between the theoretical and experimental mass of the peak equal to Error(m) (for every b- and y-peak in the original spectrum). b, MS-Recalibration performance on 1745 identified spectra of length 10 in the Shewanella data set. The template-based recalibration uses the positions of theoretical b- and y-ions in the spectrum to fit the positions of b- and y-ions in the experimental spectrum using the least squares fit algorithm. The template-free MS-Recalibration does not require knowledge of the theoretical b- and y-ions. The error distribution for non-calibrated spectra is shown for comparison. The average error is 0.13 before recalibration, 0.07 after MS-Recalibration, and 0.06 after the template-based recalibration. Before recalibration, only 79% of b/y-ions are within a mass error of 0.2 Da as compared with 96% after MS-Recalibration (similar to 98% for the template-based recalibration).
F<sc>ig</sc>. 5.
Fig. 5.
a, different fragment ions have different rank distributions (statistics are given for all spectra of length 10 from the Shewanella data set). b, distributions of mass errors of y-peaks depend on their intensity (statistics are given for all spectra of length 10 from the Shewanella data set). The high intensity peaks (solid curve) tend to have more accurate mass measurements than the lower intensity peaks (dashed curve). The fractional parts of very low intensity peaks (peaks of rank higher than 150) are centered around zero after rescaling (dashed-dot curve).
F<sc>ig</sc>. 6.
Fig. 6.
Two optimal de novo interpretations, LHEALPDPEK (a) and HLEALGAFYK (b), for a particular spectrum.
F<sc>ig</sc>. 7.
Fig. 7.
Shown are the correct peptide FINVIMQDGK as identified by InsPecT database search (a) and YPNVMLQDGK, a de novo reconstruction, for a particular spectrum (b). The former gets a score of 111 compared with a higher score of 123 for the latter.
F<sc>ig</sc>. 8.
Fig. 8.
Fraction of the spectra for which the correct peptide (as identified by the database search) has a suboptimal de novo score (depending on the length of the spectra). The distribution is shown for MS-Dictionary and PepNovo scoring functions.
F<sc>ig</sc>. 9.
Fig. 9.
MS-Dictionary accuracy as a function of the spectrum length. The percentage of spectra that were correctly reconstructed by MS-Dictionary (i.e. the correct peptide was present in the spectral dictionary) is shown on the y axis. Accuracies are computed for three different values of SpectralProbability, viz. 10−10, 10−9, and 10−8. Comparison with PepNovo (counting the percentage of spectra for which PepNovo reconstructs the correct peptide) is shown. Because the number of reconstructions for length 14 aa and above is often larger than our allowed limit of 100,000 reconstructions per spectrum, the same set of reconstructions is generated for different SpectralProbability values.
F<sc>ig</sc>. 10.
Fig. 10.
Comparison of the number of peptide identifications by various approaches, viz. InsPecT, X!Tandem, MS-Dictionary, and InsPecT ⊕ MS-GF. The searches were performed with spectra of charge 2 from the Shewanella data set within the parent mass range from 1100 to 1200 Da. The curves display the number of peptide identifications for different score thresholds (corresponding to different false discovery rates).
F<sc>ig</sc>. 11.
Fig. 11.
Venn diagram showing the overlap between peptides identified by different approaches at 5% false discovery rate. a, overlap between InsPecT, X!Tandem, and MS-Dictionary. b, overlap between InsPecT, X!Tandem, and InsPecT ⊕ MS-GF.
F<sc>ig</sc>. 12.
Fig. 12.
The percentage of peptides identified by MS-Dictionary in the translated human genome as compared with all peptides identifies in searches of human protein database. Spectral dictionaries were generated for the 21,635 selected spectra from HEK293 data set and searched against the translated human genome. For each spectrum, if the correct peptide is contained in the dictionary of the spectrum, we regarded the spectrum as identified.

Similar articles

Cited by

References

    1. Mann, M., and Wilm, M. ( 1994) Error-tolerant identification of peptides in sequence databases by peptide sequence tags. Anal. Chem. 66, 4390–4399 - PubMed
    1. Tanner, S., Shu, H., Frank, A., Wang, L., Zandi, E., Mumby, M., Pevzner, P., and Bafna, V. ( 2005) InsPecT: identification of posttranslationally modified peptides from tandem mass spectra. Anal. Chem. 77, 4626–4639 - PubMed
    1. Shilov, I., Seymour, S., Patel, A., Loboda, A., Tang, W., Keating, S., Hunter, C., Nuwaysir, L., and Schaeffer, D. ( 2007) The Paragon Algorithm: a next generation search engine that uses sequence temperature values and feature probabilities to identify peptides from tandem mass spectra. Mol. Cell. Proteomics 6, 1638–1655 - PubMed
    1. Frank, A., Tanner, S., Bafna, V., and Pevzner, P. ( 2005) Peptide sequence tags for fast database search in mass-spectrometry. J. Proteome Res. 4, 1287–1295 - PubMed
    1. Liu, C., Yan, B., Song, Y., Xu, Y., and Cai, L. ( 2006) Peptide sequence tag-based blind identification of post-translational modifications with point process model. Bioinformatics 22, e307–e313 - PubMed

Publication types

LinkOut - more resources