. 2008 Oct 1;586(19):4631-42.
doi: 10.1113/jphysiol.2008.159194. Epub 2008 Aug 14.

Role of mitochondria in modulation of spontaneous Ca2+ waves in freshly dispersed interstitial cells of Cajal from the rabbit urethra

Affiliations

Role of mitochondria in modulation of spontaneous Ca2+ waves in freshly dispersed interstitial cells of Cajal from the rabbit urethra

Gerard P Sergeant et al. J Physiol. .

Abstract

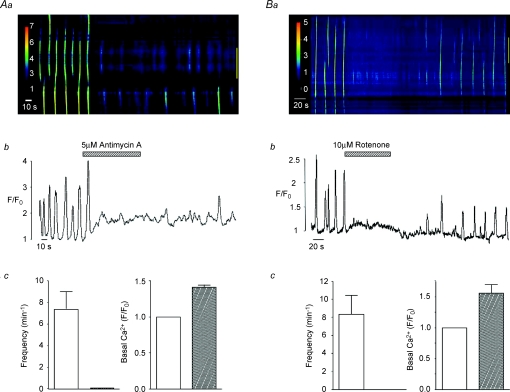
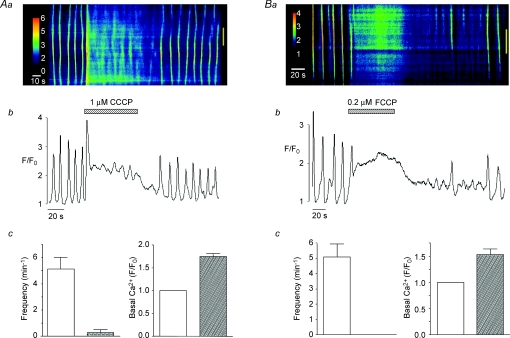
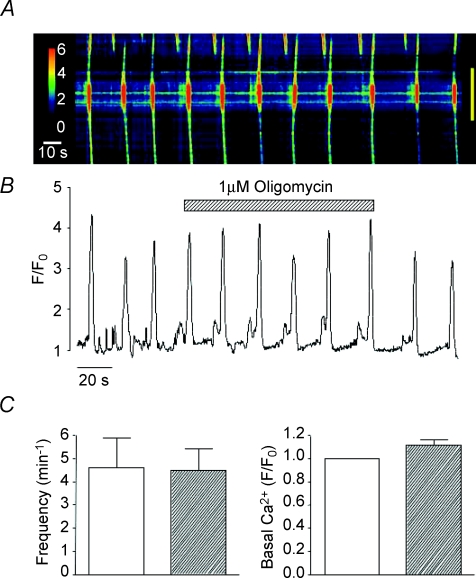
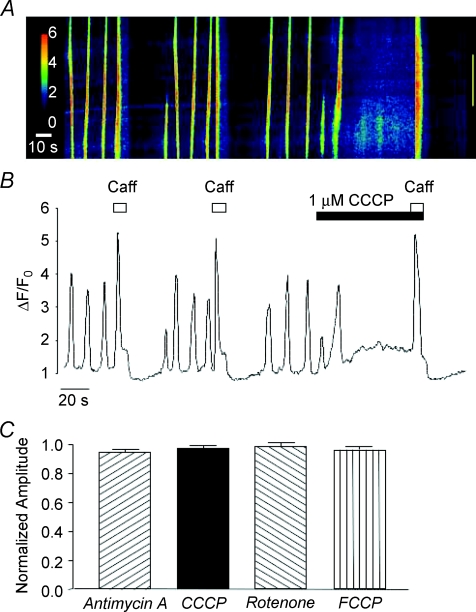
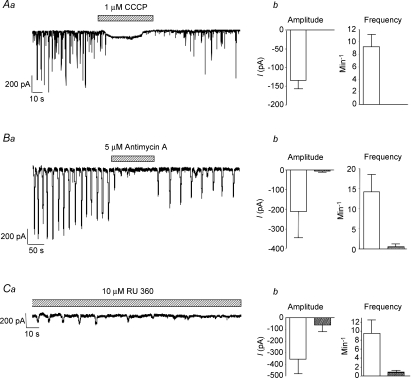
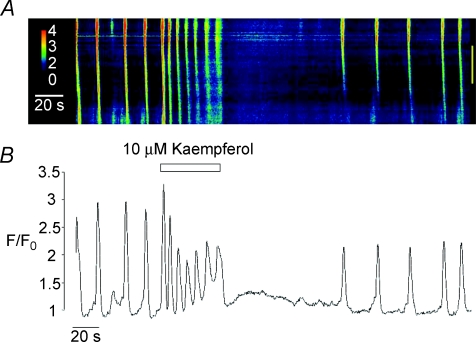
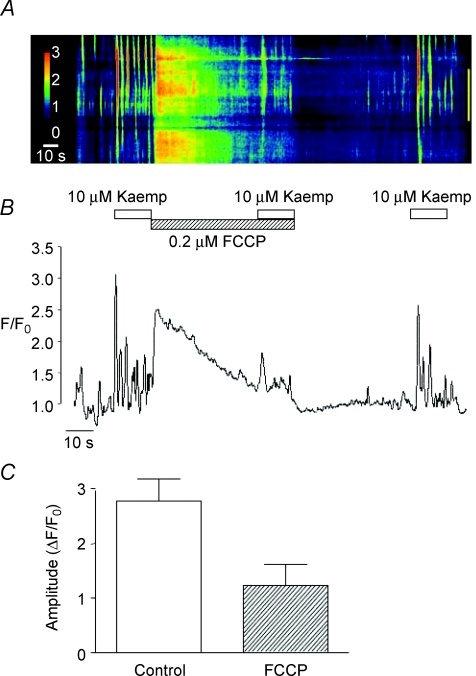
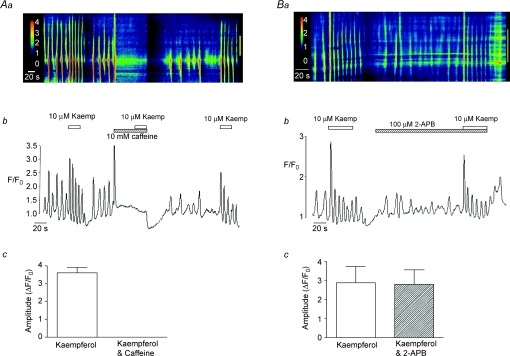
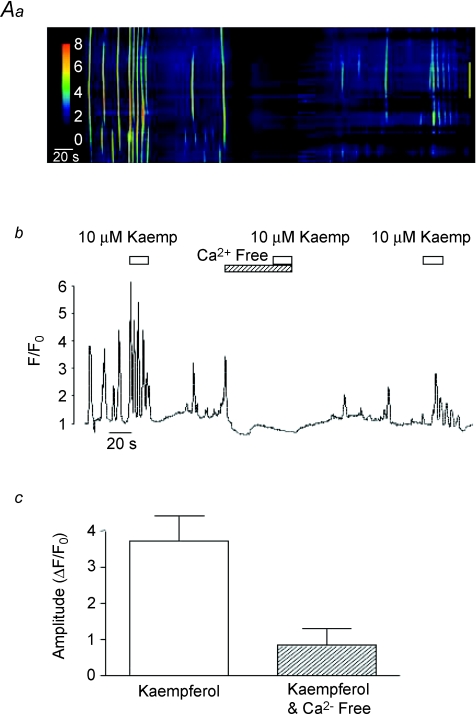
Interstitial cells of Cajal (ICC) isolated from the rabbit urethra exhibit pacemaker activity that results from spontaneous Ca(2+) waves. The purpose of this study was to investigate if this activity was influenced by Ca(2+) uptake into mitochondria. Spontaneous Ca(2+) waves were recorded using a Nipkow spinning disk confocal microscope and spontaneous transient inward currents (STICs) were recorded using the whole-cell patch clamp technique. Disruption of the mitochondrial membrane potential with the electron transport chain inhibitors rotenone (10 microm) and antimycin A (5 microm) abolished Ca(2+) waves and increased basal Ca(2+) levels. Similar results were achieved when mitochondria membrane potential was collapsed using the protonophores FCCP (0.2 microm) and CCCP (1 microm). Spontaneous Ca(2+) waves were not inhibited by the ATP synthase inhibitor oligomycin (1 microm), suggesting that these effects were not attributable to an effect on ATP levels. STICs recorded under voltage clamp at -60 mV were also inhibited by CCCP and antimycin A. Dialysis of cells with the mitochondrial uniporter inhibitor RU360 (10 microm) also inhibited STICS. Stimulation of Ca(2+) uptake into mitochondria using the plant flavonoid kaempferol (10 microm) induced a series of propagating Ca(2+) waves. The kaempferol-induced activity was inhibited by application of caffeine (10 mm) or removal of extracellular Ca(2+), but was not significantly affected by the IP(3) receptor blocker 2-APB (100 microm). These data suggest that spontaneous Ca(2+) waves in urethral ICC are regulated by buffering of cytoplasmic Ca(2+) by mitochondria.


Figures

Figure 1
Figure 1. Effect of electron transport chain inhibitors on spontaneous Ca2+ waves in urethra ICC
Aa shows a pseudo-line-scan image of spontaneous Ca2+ waves from an isolated ICC in the absence and presence of antimycin A (5 μm). Ab shows an intensity profile plot of this activity measured over the entire image. Summary graphs of the effects of antimycin A on mean frequency (min−1) of Ca2+ waves and on basal Ca2+ levels (F/F0) are shown in Ac. Ba–c show that rotenone produces similar effects to antimycin A.
Figure 2
Figure 2. Effect of protonophores on spontaneous Ca2+ waves in urethra ICC
A line-scan image showing the effect of CCCP (1 μm) on spontaneous Ca2+ waves is shown in Aa. Ab shows an intensity profile plot of this record. Summary bar charts plotting the mean frequency (min−1) of Ca2+ waves and basal Ca2+ levels (F/F0) in the absence and presence of CCCP are shown in Ac. Ba–c shows that FCCP produces similar effects to CCCP.
Figure 3
Figure 3. Effect of oligomycin on spontaneous Ca2+ waves in urethra ICC
A representative pseudo-line-scan image and corresponding intensity profile plot demonstrating that oligomycin did not inhibit spontaneous Ca2+ waves is shown in A and B. Summary data, plotting the effects of oligomycin on the mean frequency of Ca2+ waves and basal Ca2+ levels, are shown in C.
Figure 4
Figure 4. Effect of mitochondrial inhibitors on caffeine-evoked Ca2+ transients
A and B are a representative pseudo-line-scan image and intensity profile plot showing that caffeine-induced Ca2+ transients are not inhibited by application of CCCP. The bar chart shown in C plots the mean peak amplitude of the caffeine-evoked Ca2+ transient in the presence of antimycin A, CCCP, rotenone and FCCP as a function of that evoked under control conditions before addition of each drug.
Figure 5
Figure 5. Effect of mitochondrial inhibitors on STICs
Aa shows the effect of CCCP (1 μm) on STICs in a cell held at −60 mV. Ab, summary of the effect of CCCP on STICs from 7 cells. Ba shows the effect of antimycin A (5 μm) on STICs in a cell held at −60 mV. Bb, summary of the effect of antimycin A on STICs from 5 cells. Ca shows the effect of dialysis of RU360 (10 μm) on STICs in a cell held at −60 mV. The summary data shown in Cb plot the mean amplitude and frequency of STICs recorded from 7 cells dialysed with RU360 (filled bars) and 9 cells without the drug (open bars).
Figure 6
Figure 6. Effect of the mitochondrial uniporter opener kaempferol on Ca2+ waves
A is a linescan image showing the effect of kaempferol (10 μm) on spontaneous Ca2+ waves in isolated urethra ICC. An intensity profile plot of this record is shown in B.
Figure 7
Figure 7. Effect of FCCP on kaempferol-induced Ca2+ waves
A representative line-scan image showing the effect of kaempferol (10 μm) in the absence and presence of FCCP (0.2 μm) is shown in A. An intensity profile plot of this record is shown in B. A summary bar chart plotting the mean amplitude (ΔF/F0) of the initial kaempferol-induced Ca2+ transient in the absence and presence of FCCP is shown in C.
Figure 8
Figure 8. Effect of caffeine and 2-APB on kaempferol-induced Ca2+ waves
Aa is a line-scan image showing the effect of kaempferol before and during exposure to 10 mm caffeine. Ab represents the intensity profile plot of the data shown in Aa. A summary plot of the mean amplitude (ΔF/F0) of the initial kaempferol-induced Ca2+ transient in the absence and presence of caffeine is shown in Ac. Ba is a line-scan image showing the effect of kaempferol before and during exposure to 2-APB (100 μm). Bb represents the intensity profile plot of the data shown in Ba. A summary plot of the mean amplitude (ΔF/F0) of the initial kaempferol-induced Ca2+ transient in the absence and presence of 2-APB is shown in Bc.
Figure 9
Figure 9. Effect of Ca2+-free media on kaempferol-induced Ca2+ waves
A typical line-scan image showing the effect of kaempferol before and during exposure to Ca2+-free media is shown in A. An intensity profile plot of this record is plotted in B and a summary plot of the mean amplitude (ΔF/F0) of the initial kaempferol-induced Ca2+ transient in the absence and presence of Ca2+-free media is shown in C.

Similar articles

Cited by

References

    1. Boitier E, Rea R, Duchen MR. Mitochondria exert a negative feedback on the propagation of intracellular Ca2+ waves in rat cortical astrocytes. J Cell Biol. 1999;145:795–808. - PMC - PubMed
    1. Bootman MD, Collins TJ, Mackenzie L, Roderick HL, Berridge MJ, Peppiatt CM. 2-Aminoethoxydiphenyl borate (2-APB) is a reliable blocker of store-operated Ca2+ entry but an inconsistent inhibitor of InsP3-induced Ca2+ release (Review) FASEB J. 2002;16:1145–1150. - PubMed
    1. Bradley E, Hollywood MA, Johnston L, Large RJ, Matsuda T, Baba A, McHale NG, Thornbury KD, Sergeant GP. Contribution of reverse Na+–Ca2+ exchange to spontaneous activity in interstitial cells of Cajal in the rabbit urethra. J Physiol. 2006;574:651–661. - PMC - PubMed
    1. Bradley E, Hollywood MA, McHale NG, Thornbury KD, Sergeant GP. Pacemaker activity in urethral interstitial cells is not dependent on capacitative calcium entry. Am J Physiol Cell Physiol. 2005;289:C625–C632. - PubMed
    1. Burdakov D, Petersen OH, Verkhratsky A. Intraluminal calcium as a primary regulator of endoplasmic reticulum function. Cell Calcium. 2005;38:303–310. - PubMed

Publication types

MeSH terms

LinkOut - more resources