

Male dominance rarely skews the frequency distribution of Y chromosome haplotypes in human populations
- PMID: 18703660
- PMCID: PMC2575272
- DOI: 10.1073/pnas.0710158105
Male dominance rarely skews the frequency distribution of Y chromosome haplotypes in human populations
Abstract
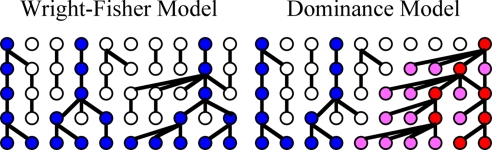
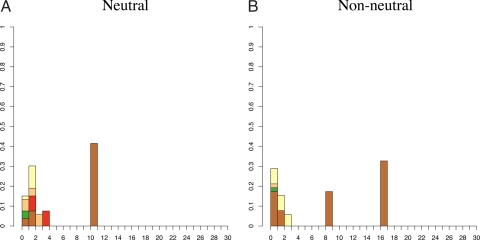
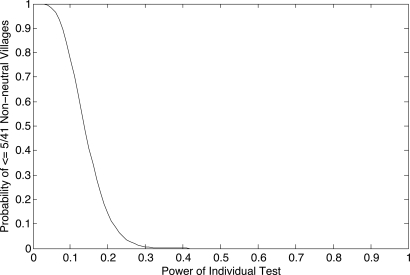
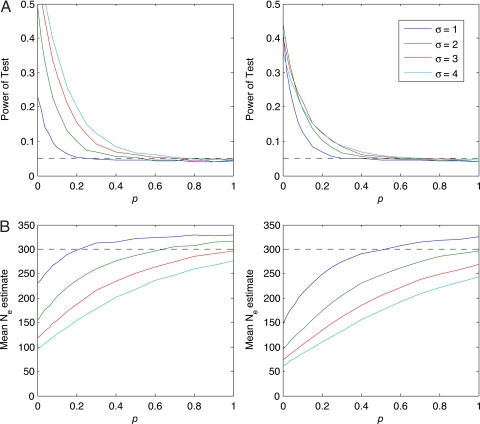
A central tenet of evolutionary social science holds that behaviors, such as those associated with social dominance, produce fitness effects that are subject to cultural selection. However, evidence for such selection is inconclusive because it is based on short-term statistical associations between behavior and fertility. Here, we show that the evolutionary effects of dominance at the population level can be detected using noncoding regions of DNA. Highly variable polymorphisms on the nonrecombining portion of the Y chromosome can be used to trace lines of descent from a common male ancestor. Thus, it is possible to test for the persistence of differential fertility among patrilines. We examine haplotype distributions defined by 12 short tandem repeats in a sample of 1269 men from 41 Indonesian communities and test for departures from neutral mutation-drift equilibrium based on the Ewens sampling formula. Our tests reject the neutral model in only 5 communities. Analysis and simulations show that we have sufficient power to detect such departures under varying demographic conditions, including founder effects, bottlenecks, and migration, and at varying levels of social dominance. We conclude that patrilines seldom are dominant for more than a few generations, and thus traits or behaviors that are strictly paternally inherited are unlikely to be under strong cultural selection.
Conflict of interest statement
The authors declare no conflict of interest.
Figures
References
-
- Clarke AL, Low BS. Testing evolutionary hypotheses with demographic data. Popul Dev Rev. 2001;27:633–660.
-
- Winterhalder B, Smith E. Analyzing adaptive strategies: Human behavioral ecology at twenty-five. Evol Anthropol. 2000;9:51–72.
-
- Cannings C. The latent roots of certain Markov chains arising in genetics: A new approach, I. Haploid models. Adv Appl Probab. 1974;6:260–290.
-
- Sibert A, Austerlitz F, Heyer E. Wright-Fisher revisited: The case of fertility correlation. Theor Popul Biol. 2002;62:181–197. - PubMed
-
- Ewens WJ. The sampling theory of selectively neutral alleles. Theor Popul Biol. 1972;3:87–112. - PubMed
MeSH terms
LinkOut - more resources
Full Text Sources
