. 2008 Sep 1;22(17):2359-69.
doi: 10.1101/gad.1682308. Epub 2008 Aug 14.

Cooperative action of NC2 and Mot1p to regulate TATA-binding protein function across the genome

Affiliations

Cooperative action of NC2 and Mot1p to regulate TATA-binding protein function across the genome

Folkert J van Werven et al. Genes Dev. .

Abstract

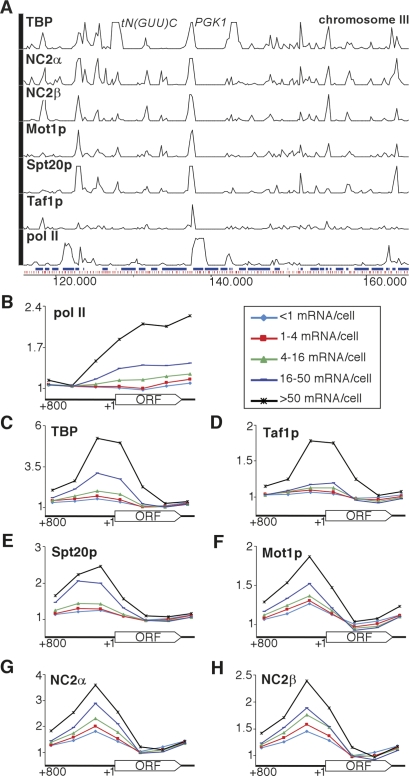
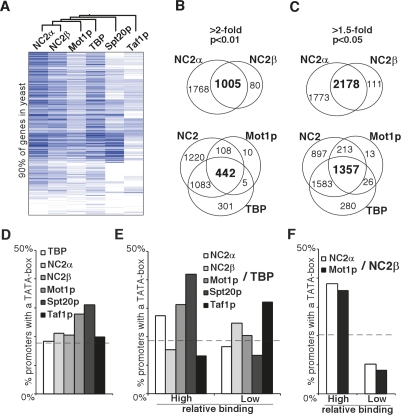
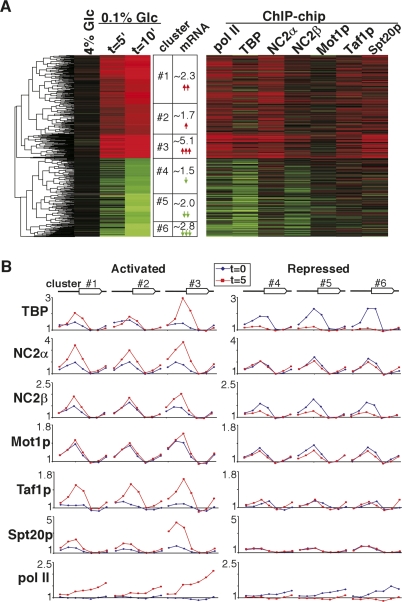
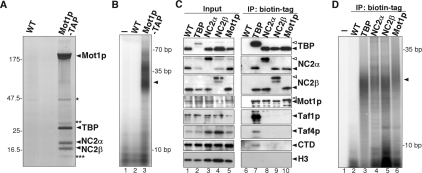
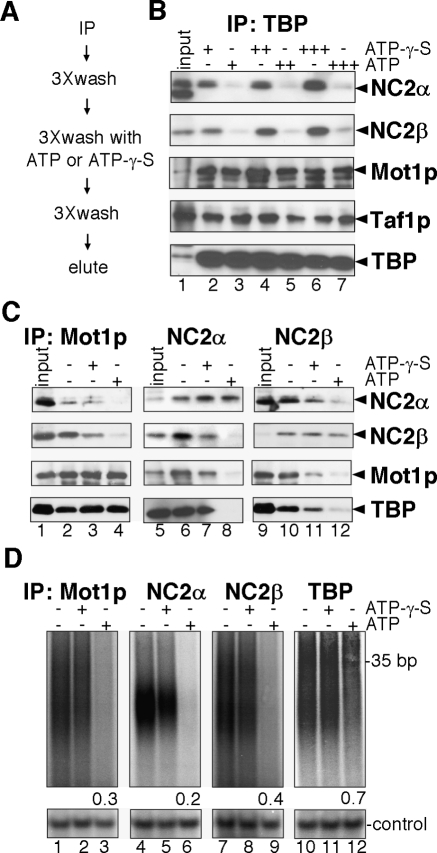
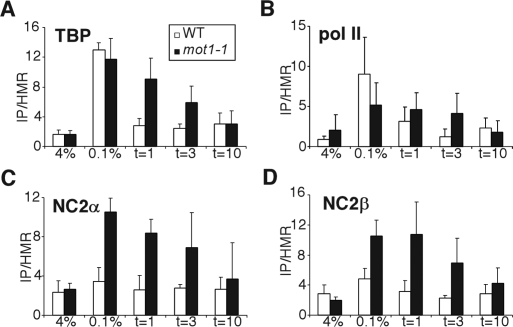
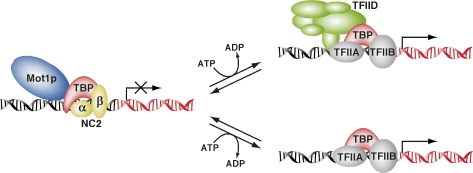
Promoter recognition by TATA-binding protein (TBP) is an essential step in the initiation of RNA polymerase II (pol II) mediated transcription. Genetic and biochemical studies in yeast have shown that Mot1p and NC2 play important roles in inhibiting TBP activity. To understand how TBP activity is regulated in a genome-wide manner, we profiled the binding of TBP, NC2, Mot1p, TFIID, SAGA, and pol II across the yeast genome using chromatin immunoprecipitation (ChIP)-chip for cells in exponential growth and during reprogramming of transcription. We find that TBP, NC2, and Mot1p colocalize at transcriptionally active pol II core promoters. Relative binding of NC2alpha and Mot1p is higher at TATA promoters, whereas NC2beta has a preference for TATA-less promoters. In line with the ChIP-chip data, we isolated a stable TBP-NC2-Mot1p-DNA complex from chromatin extracts. ATP hydrolysis releases NC2 and DNA from the Mot1p-TBP complex. In vivo experiments indicate that promoter dissociation of TBP and NC2 is highly dynamic, which is dependent on Mot1p function. Based on these results, we propose that NC2 and Mot1p cooperate to dynamically restrict TBP activity on transcribed promoters.


Figures

Figure 1.
Figure 1.
ChIP–chip analysis of TBP, NC2α, NC2β, TBP, Mot1p, Taf1p, Spt20p, and pol II and the correlation to gene expression levels. (A) Overview plot of a part of chromosome III (115–165 kb) of the different binding profiles is shown. The locations of the oligos on the array are indicated in red and gene annotations in blue. The binding profiles are presented on the same scale (one- to fourfold over background). The location of the promoters for the pol II-transcribed PGK1, and for the pol III-transcribed tN(GUU)C genes are indicated at the top of the figure. Please note that as expected (Kuras et al. 2000) low levels of Taf1p can be detected at the TAF-independent PGK1 promoter. (B–H) Average binding analysis of pol II, TBP, Taf1p, Spt20p, Mot1p, NC2α, and NC2β for gene groups with <1, 1–4, 4–16, 16–50, or >50 mRNA copies per cell. Average binding profiles were determined for regions in the ORF (5′ end, middle, and 3′ end), promoter (fragments: −800/−551, −550/−301 or −300/−50 relative to the ATG start codon) and 3′ end region (200 bp downstream from the ORF).
Figure 2.
Figure 2.
The genomic binding profiles of NC2 and Mot1p overlap. (A) Cluster diagram of the average promoter binding profiles of 5865 genes (clustered vertically). Dark blue indicates strong binding and white indicates no binding. The dendrogram at the top of the panel represents the hierarchical cluster analysis of the different binding profiles. (B,C) The overlap between significantly bound promoters of NC2α and NC2β (top panels), NC2 (NC2α or NC2β), TBP, and Mot1p (bottom panels) binding profiles are presented in Venn diagrams. Significantly bound promoters were selected in an ANOVA analysis with P-value of <0.01 and an enrichment of at least twofold (B) or P-value of <0.05 and a ratio of at least 1.5-fold (C). (D) Binding of TBP complexes to TATA-box-containing promoters. Promoters significantly bound (P < 0.05 and 1.5-fold enrichment) by the indicated factors were analyzed for occurrence of a canonical TATA-box. On the Y-axis the percentage of promoters containing a TATA-box is indicated for each binding profile. The dashed line indicates the overall percentage of TATA-box promoters in our data set. (E) Occurrence of TATA-box promoters within groups of promoters that were selected for relative high or low occupancy of the indicated TBP regulators. The ratios of NC2α, NC2β, Mot1p, Spt20p, or Taf1p over TBP were computed for significantly bound promoters. Subsequently, promoters were ranked and the occurrence of TATA-box-containing promoters was analyzed for the bottom 10% and top 10% of promoters. (F) Same as E except that the ratios were related to NC2β.
Figure 3.
Figure 3.
Reprogramming of pol II, TBP, NC2α, NC2β, Mot1p, Taf1p, and Spt20p binding during a shift from 4% to 0.1% glucose-containing medium. (A) Cluster diagram of genes that significantly changed in expression at 10 min after shifting cells from 4% to 0.1% glucose. Red indicates activated genes and green indicates repressed genes. Based on the gene expression we selected six top-level clusters that were used for subsequent analysis in B. The corresponding change in binding was measured at 5 min after the low glucose shift for TBP, NC2α, NC2β, Mot1p, Taf1p, and Spt20p at promoters and pol II in the ORF. Red indicates increased binding and green decreased binding. (B) Average binding of TBP, NC2α, NC2β, Mot1p, Taf1p, Spt20p, and pol II at t = 0 (blue line) and t = 5 min (red line) within the six clusters that are indicated in A.
Figure 4.
Figure 4.
TBP, NC2, and Mot1p copurify in chromatin extracts. (A) Chromatin extracts were isolated from C-terminal TAP-tagged Mot1p yeast cells and affinity-purified using a TAP-tag purification procedure. Eluates were separated on a SDS–polyacrylamide gradient gel, and Coomassie-stained bands were excised, subjected to in-gel tryptic digestion, and analyzed by mass spectrometry. The band labeled Mot1p was identified with 108 unique peptides with a 46% coverage. The labeled TBP, NC2α, and NC2β bands were identified with 17 (42% coverage), 19 (63% coverage), or 15 (54% coverage) unique peptides, respectively. The band labeled with one asterisk (*) is also present in the mock and represents Tef1p. The band labeled with two asterisks (**) mostly contained Mot1p and TBP derived peptides. In the band labeled with three asterisks (***), mostly NC2α peptides were found. (B) To determine the presence of DNA, part of the purification described in A was labeled in in a T4 polynucleotide kinase reaction using [γ-32P]ATP and loaded on a 20% polyacrylamide gel. The arrow indicates the position of the diffuse band. (C) Chromatin extracts were isolated from biotin-tagged TBP, NC2, or Mot1p strains expressing Escherichia coli BirA biotin ligase. Biotinylated proteins were immobilized using streptavidin beads. Input and eluates were analyzed by immublotting and probed for the indicated proteins. As a control, a nontagged strain expressing BirA was used. (D) To determine the presence of DNA, part of the samples described in C was eluted in TE buffer. Subsequently, samples were treated similarly to those described in B.
Figure 5.
Figure 5.
The TBP–NC2–Mot1p–DNA complex is disrupted upon treatment with ATP. (A) Experimental scheme. (B) TBP–NC2–Mot1p was isolated via TBP and treated as described in A with 1 μM (lanes 2,3), 10 μM (lanes 4,5), and 100 μM (lanes 6,7) of ATP or ATP-γ-S as indicated. (C) TBP-NC2-Mot1p was isolated via Mot1p (lanes 1–4), NC2α (lanes 5–8), and NC2β (lanes 9–12). Samples were assayed as described in A, and were either untreated (lanes 2,6,10), treated with 10 μM ATP-γ-S (lanes 3,7,11), or ATP (lanes 4,8,12). (D) To determine the presence of DNA, samples were treated like B and C except that 1 μM of ATP or ATP-γ-S was used, and samples were eluted in TE buffer. Subsequently, samples were radioactively labeled in a T4 polynucleotide kinase reaction using [γ -32P]ATP and analyzed on a 20% polyacrylamide gel. To control for equal labeling efficiency a single-stranded 19-mer oligo was included in each labeling reaction. The samples were quantified and corrected for the 19-mer control oligo and nontreated sample. The relative quantification of DNA levels for each sample is indicated.
Figure 6.
Figure 6.
The kinetics of TBP, NC2, and pol II dissociation during transcriptional repression of the HXT2 gene. Wild-type or mot1-1 mutant cells grown in 4% glucose-containing medium were shifted to 0.1% glucose for 5 min. Subsequently, glucose was added back to 4% and samples were taken after 1, 3, and 10 min. Using different antibodies, the binding of TBP (A), pol II (B), NC2α (C), and NC2β (D) in wild-type and mot1-1 mutant yeast strains were analyzed. A primerset (−170/−76) corresponding to the core promoter of HXT2 was used for quantification of isolated DNA. A fragment of the HMR locus was used as a nonbinding control.
Figure 7.
Figure 7.
Model for the interplay between TBP–NC2–Mot1p and TFIID or free TBP. On an active promoter the Mot1p–NC2–TBP complex turns over to allow TFIID or free TBP association to direct productive preinitiation complex assembly and transcription.

Similar articles

Cited by

References

    1. Albert T.K., Grote K., Boeing S., Stelzer G., Schepers A., Meisterernst M. Global distribution of negative cofactor 2 subunit-α on human promoters. Proc. Natl. Acad. Sci. 2007;104:10000–10005. - PMC - PubMed
    1. Andrau J.C., Van Oevelen C.J., Van Teeffelen H.A., Weil P.A., Holstege F.C., Timmers H.T. Mot1p is essential for TBP recruitment to selected promoters during in vivo gene activation. EMBO J. 2002;21:5173–5183. - PMC - PubMed
    1. Auble D.T., Hansen K.E., Mueller C.G., Lane W.S., Thorner J., Hahn S. Mot1, a global repressor of RNA polymerase II transcription, inhibits TBP binding to DNA by an ATP-dependent mechanism. Genes & Dev. 1994;8:1920–1934. - PubMed
    1. Basehoar A.D., Zanton S.J., Pugh B.F. Identification and distinct regulation of yeast TATA box-containing genes. Cell. 2004;116:699–709. - PubMed
    1. Blake W.J., Balazsi G., Kohanski M.A., Isaacs F.J., Murphy K.F., Kuang Y., Cantor C.R., Walt D.R., Collins J.J. Phenotypic consequences of promoter-mediated transcriptional noise. Mol. Cell. 2006;24:853–865. - PubMed

Publication types

MeSH terms